The enterprise user manual for the Kupinga anti-fraud platform.
A comprehensive guide for fraud analysts, compliance officers, operations engineers, system administrators and implementation partners. Catch what others miss.
Document
Enterprise Software User Manual
Product
Kupinga Anti-Fraud Platform
Version
v1.0 · RC-2026-05-20
Issued
21 May 2026
About this manual
Kupinga · v1.0 · 2026-05-21
About this manual
Why this document exists and how it is organised.
Read me first
This manual documents the day-to-day operation, configuration and administration
of the Kupinga anti-fraud platform. It is the canonical reference for everyone
who interacts with the application — from the analyst clearing the morning alert
queue, through the compliance officer drafting a Suspicious Activity Report, to
the SRE who watches the streaming fabric and the implementation partner who
onboards a new tenant bank.
Every module that ships in the platform is documented here with its purpose,
its audience, the fields and actions on the screen, the step-by-step usage for
the most common workflows, the role and permission required to use it, the
business rules and operational guardrails that govern it, and a screenshot
taken from the live application so the reader can match the page on the screen
to the description on the page.
The manual is organised by the operator's mental model rather than by service
boundary. Workstream surfaces (Home, Investigations, Compliance, Screening,
Adverse Media, Dashboards) appear first because they are where the daily
work happens. Configuration surfaces (Detection, Administration, Ingestion,
Operations) follow. Reference material sits at the back.
Audience & roles
The platform is built around a small number of well-known operating roles. Most readers will fit one of the profiles below. The permission model (see Permissions reference) controls exactly what each role can see and do.
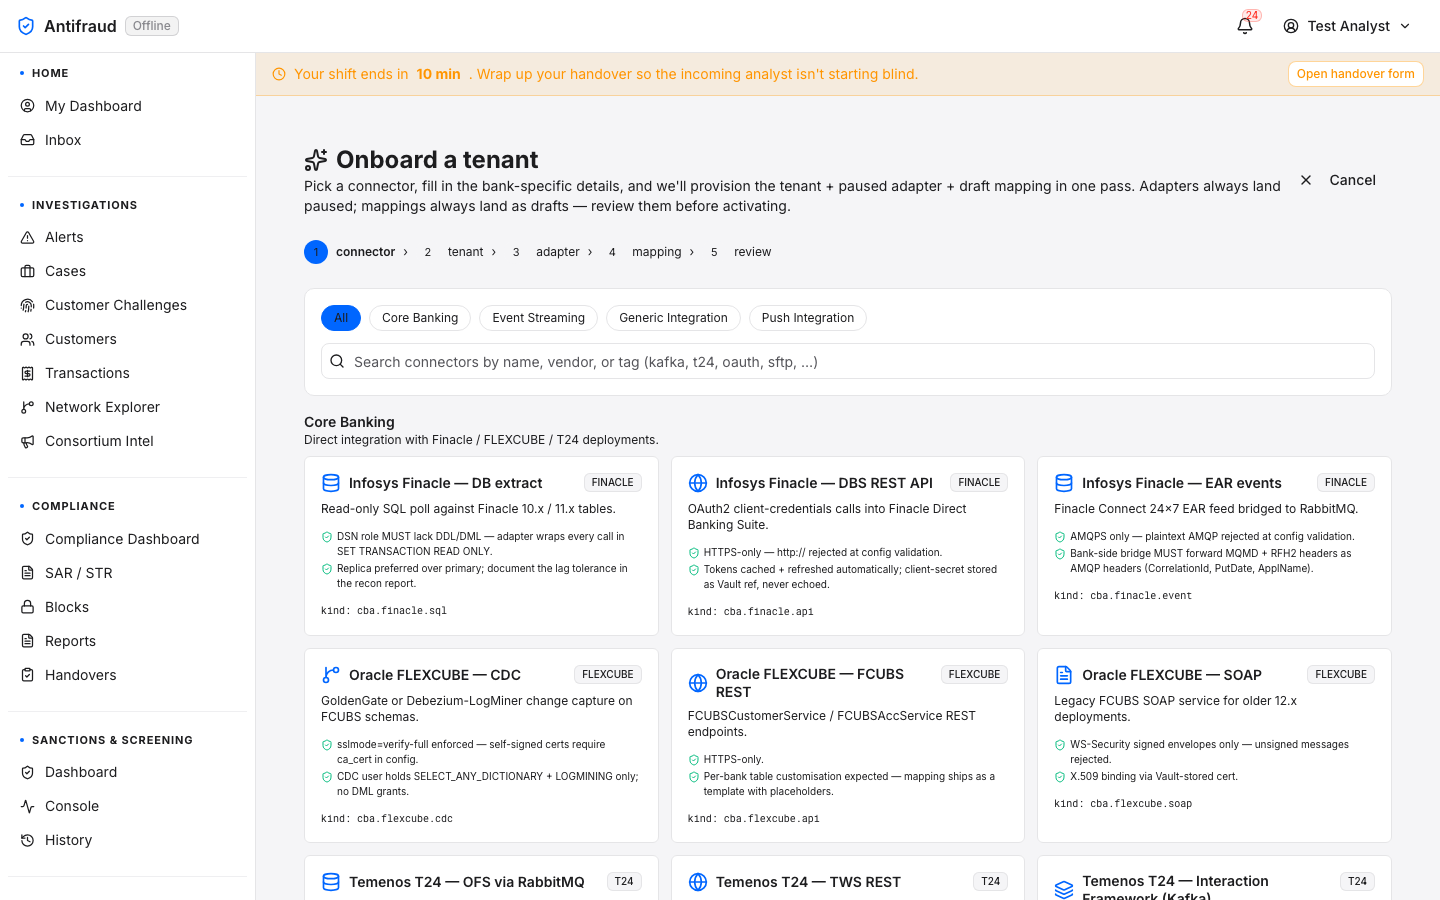
How to bring a new tenant bank live without disrupting the production platform.
Conventions used in this document
NoteAn informational call-out. Provides extra context but does not change the procedure.
TipA recommended way of working. Following tips is optional but they reduce error.
CautionA guardrail. Ignoring it can produce noisy alerts, broken queues, or audit findings.
CriticalAn irreversible or regulator-visible operation. Read carefully before you act.
Inline literals such as routes, permission keys, configuration values and CLI commands are rendered in mono-spaced type. Field names appear the same way. Screenshots are reproduced with a thin border and a caption identifying the page, the section of the page and what the reader should be looking at.
Getting started
The platform is a web application. To use it you need:
A modern desktop browser. Chromium-based browsers (Chrome, Edge, Brave) and Safari are tested every release. Internet Explorer is not supported.
A user account, provisioned by your institution's administrator (see Users & RBAC) and assigned to one or more roles.
Network access to the institution's Kupinga URL — typically https://antifraud.<your-bank> on the corporate network or VPN.
If your institution uses single sign-on, your IdP account (Active Directory, Okta or similar) — you will not need a separate Kupinga password.
Navigating the platform
The application has four persistent surfaces: a top bar (global search, notifications, and your profile menu); a left sidebar listing the high-level modules you are allowed to see; a horizontal module submenu directly below the page header listing the pages within the module you are currently in; and a main content area where the active page renders.
Navigation is two-level. The left sidebar shows one entry per module — Home, Dashboards, Investigations, Compliance, Sanctions & Screening, Adverse Media, Detection, Administration, Ingestion, Platform, Operations, and Settings — and is permission-filtered, so you see only the modules your role grants. Selecting a module opens its default page and keeps that module highlighted in the sidebar for as long as you stay within it.
The module submenu — the horizontal row of tabs below the page header — lists the individual pages of the active module. For example, inside Investigations the submenu shows Alerts, Cases, Customer Challenges, Customers, Transactions, Network Explorer, and Consortium Intel. The page you are viewing is highlighted in the submenu, and you move between pages of a module from here rather than from the left sidebar.
So two cues always tell you where you are: the module is highlighted in the left sidebar, and the page is highlighted in the module submenu. On smaller screens the left sidebar collapses behind a menu (hamburger) button and the module submenu scrolls horizontally. Platform and Settings are single-page modules — selecting them opens their page directly, with no submenu.
NoteScreenshots in this manual are being refreshed to the two-level navigation. Some images may still show the previous single-level sidebar; the surrounding text describes the current navigation.
Access & sign-in
How to authenticate, manage your session, and recover access.
Sign-in page
Audience: everyone/login
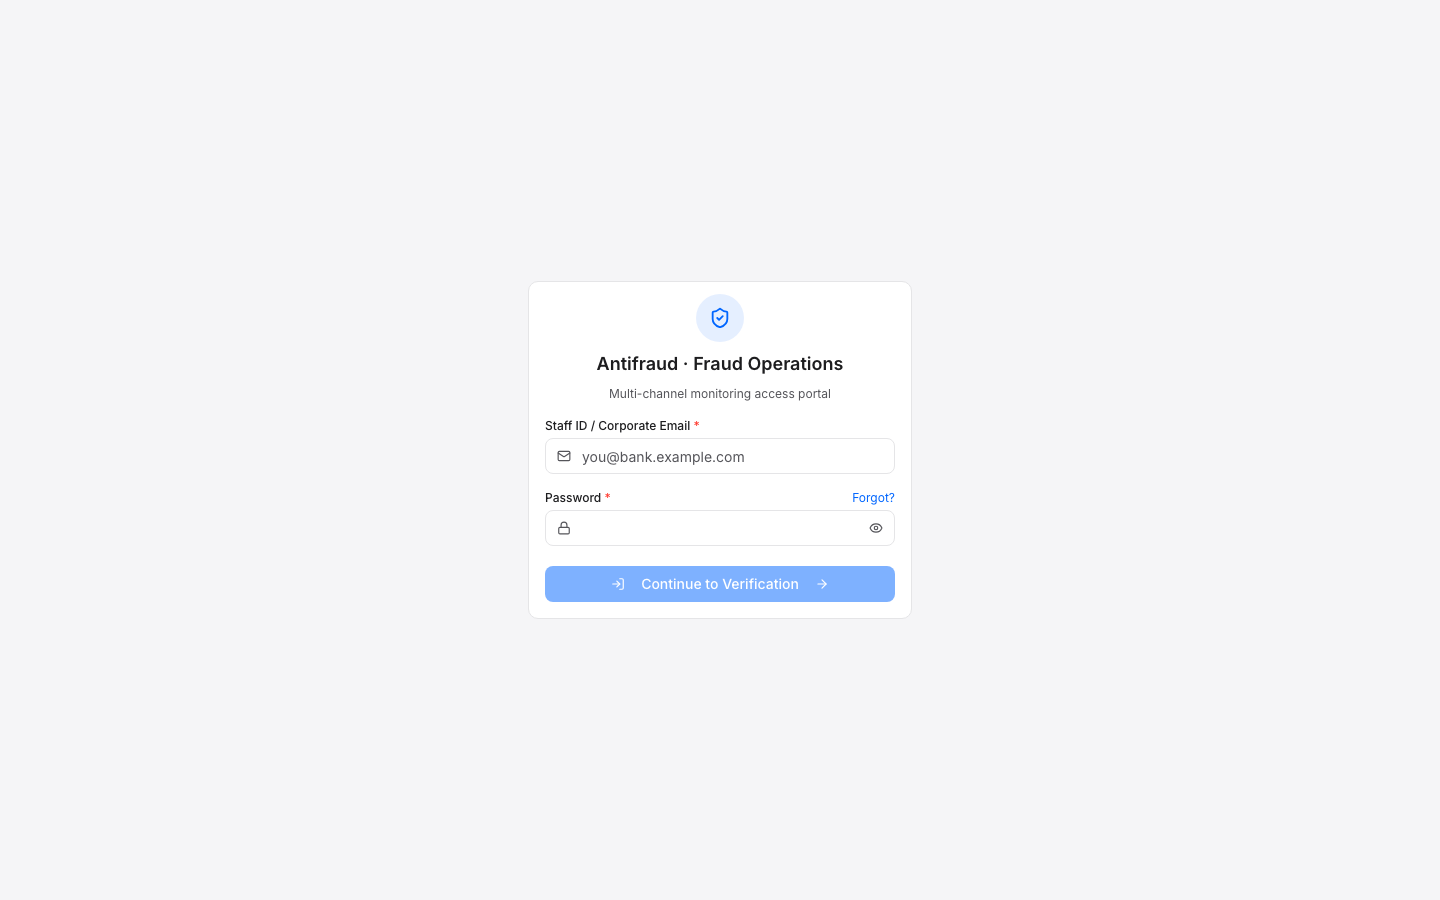
The sign-in page is the only unauthenticated surface in the application. Every other URL redirects here when no session is present, preserving the deep-link as a ?next= parameter so the user is sent back to the requested page after authentication.
Figure A1 — Sign-in page. Email + password form. If your institution has configured an identity provider, a Continue with SSO button appears above the form.
Key fields
Field
Type
Notes
Email
email
Your work email address as provisioned in Users & RBAC.
Password
password
Subject to your institution's complexity and rotation policy. Repeated failures lock the account; an administrator must unlock it from Users & RBAC.
Continue with SSO
action
Visible only when OIDC is enabled. Hands off to your IdP for credential capture and MFA.
How to sign in
Open the URL provided by your administrator. The address may differ between staging and production environments.
Enter your work email and password, or click Continue with SSO if your institution uses single sign-on.
If your account is provisioned with multi-factor authentication, complete the MFA challenge.
CautionEvery sign-in attempt — success and failure — is recorded in the Access log. Failed attempts beyond the configured threshold lock the account.
Common issues
Account is locked. Five consecutive failed sign-ins lock the account. An administrator must unlock it from Users & RBAC; the manual procedure is documented in that section.
SSO button does not appear. OIDC is disabled for your environment. Use the password form.
You are redirected back to /login after submitting. Your session expired before the redirect completed. Sign in again — the deep link is preserved.
Forgot password
Audience: everyone/login/forgot
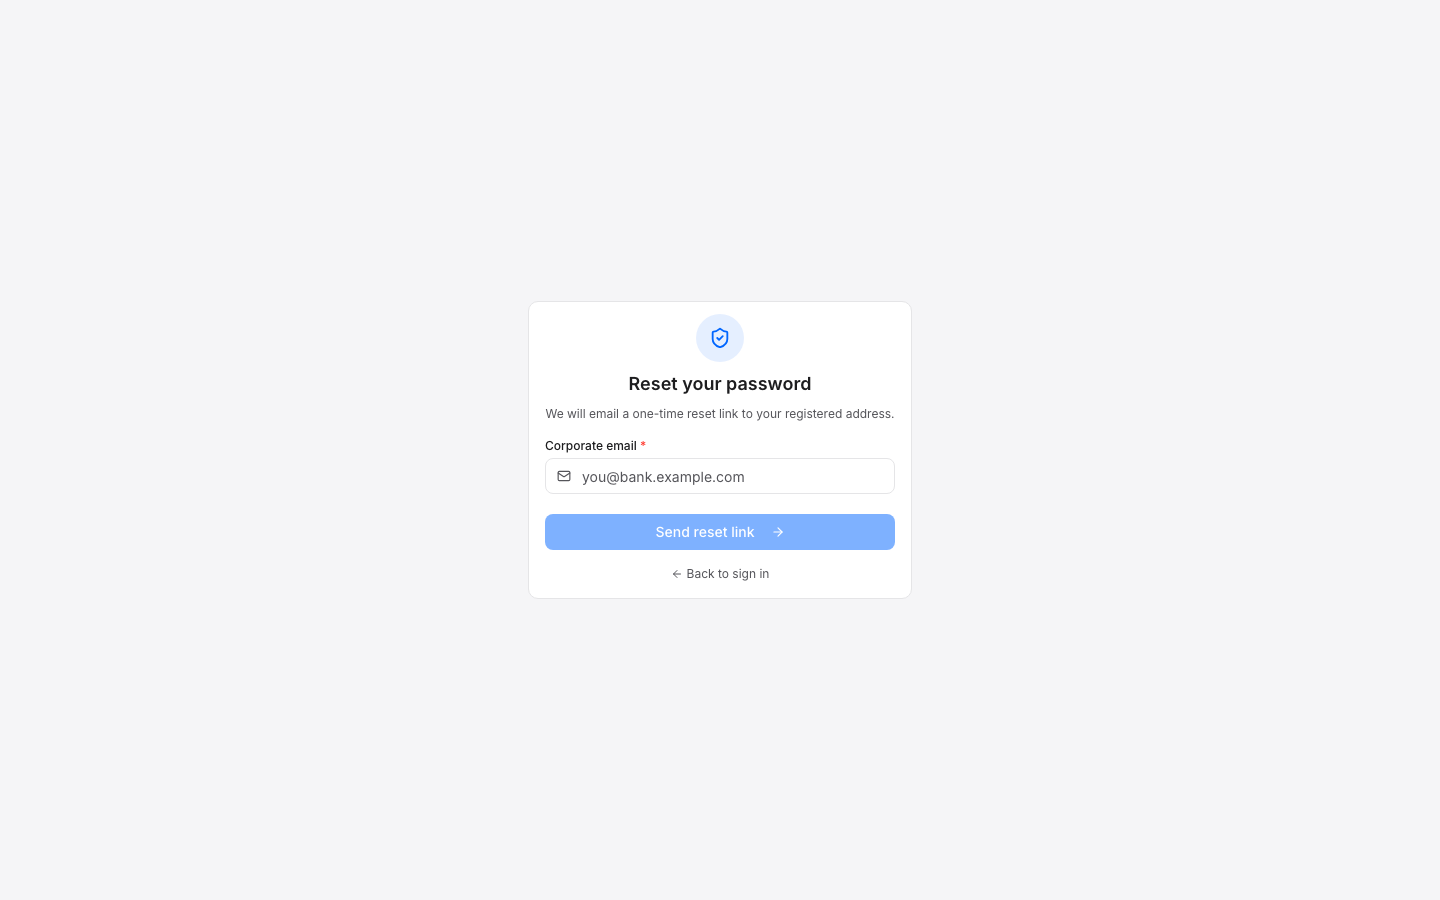
If you have forgotten your password, request a reset link. The platform issues the same generic response whether the email is registered or not, so attackers cannot enumerate accounts by status code.
Figure A2 — Forgot password. Submit your work email; a reset link is dispatched if the account exists. Same response either way to prevent enumeration.
From the sign-in page, click Forgot password?.
Enter your work email and submit.
Check the email account for the reset link. The link expires after the duration configured in SLA policy (default 30 minutes).
Follow the link to set a new password.
NoteInstitutions that use SSO disable the password reset flow; users reset their credentials through the IdP rather than through Kupinga.
Sessions, shifts and timeouts
Audience: everyoneTop-right of every page
Your session has two clocks. The first is the security clock: the access token rotates silently every few minutes and expires after the maximum lifetime configured in the SLA policy. The second is the operational clock: the active shift. Analysts work in shift windows so the institution has a clear chain of custody and the system can route alerts to whoever is actually on duty.
You will see a banner across the top of every page when your shift is within ten minutes of ending. The banner links to the End-of-shift form so you can complete your handover before you sign out.
TipOpen the user menu in the top-right to see your role, your current shift window, and a one-click sign-out. Signing out cancels the active shift but does not file a handover — file one first if you have open items.
Home
Where every signed-in user lands, regardless of role.
The Home section gives every user one place to start the day. My Dashboard is the personal landing page — it adapts to the role so an executive sees portfolio-level signals and an analyst sees personal queue counters. The Unified Inbox aggregates every actionable item from across the platform into a single triage workspace.
My Dashboard
All signed-in users/my-dashboardRole-adaptive
Purpose
One personal landing page that adapts to the user's role and shows what matters most to that audience without a configuration step.
Audience
Every signed-in user. No permission gate at the link itself.
When to use
First page of the day. Quick reset between deep investigations. The place to go when an alert tab has been open for too long.
My Dashboard is the institution's standard personal home page. Rather than presenting one generic dashboard to everyone, it picks one of four curated variants based on the signed-in user's role and permission set, so a compliance officer never has to skip past analyst counters and an analyst never has to scroll past board-level KPIs.
How the variant is chosen
The page reads /api/v1/me on mount and applies the following resolution order — the first matching rule wins:
SAR/STR pipeline, regulatory return schedule and compliance calendar are the daily work of this role.
Principal holds alerts:read or cases:read
Analyst — personal-queue dashboard
The "what is on my plate right now" view that an on-shift analyst needs to start the day.
None of the above
Viewer welcome — quick-link cards for whatever the user can actually open
API users, observers, partner read-only accounts — give them a friendly landing instead of a half-empty page.
NoteThe variant is decided on every page mount, so changing role tier (or being granted a JIT permission mid-day) flips the dashboard the next time you navigate to it. There is no manual override; the platform never lets a user pick a dashboard their permissions do not match.
Variant 1 — Executive (admin)
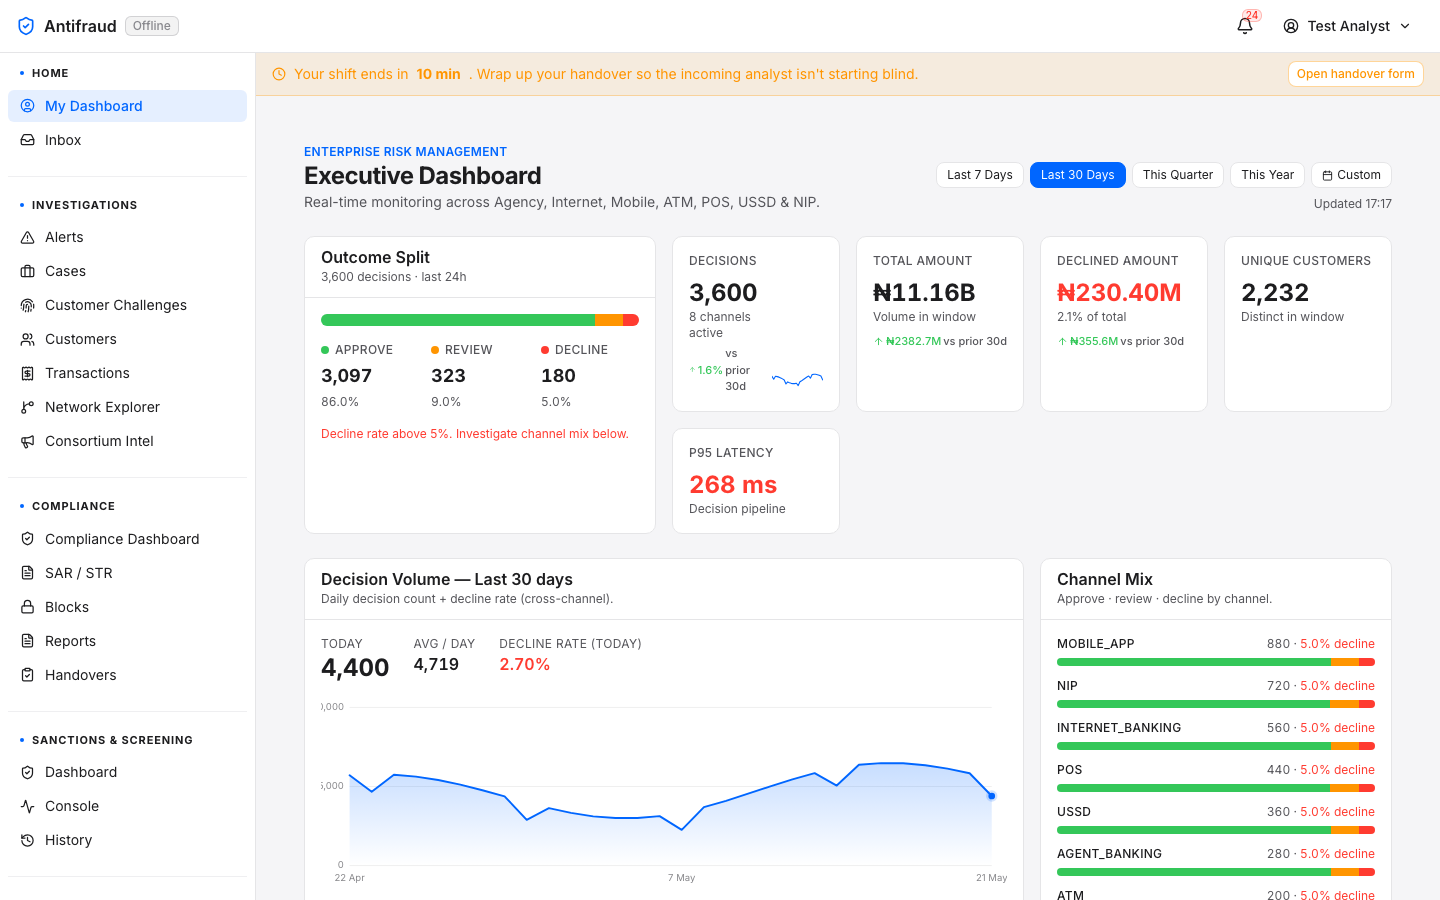
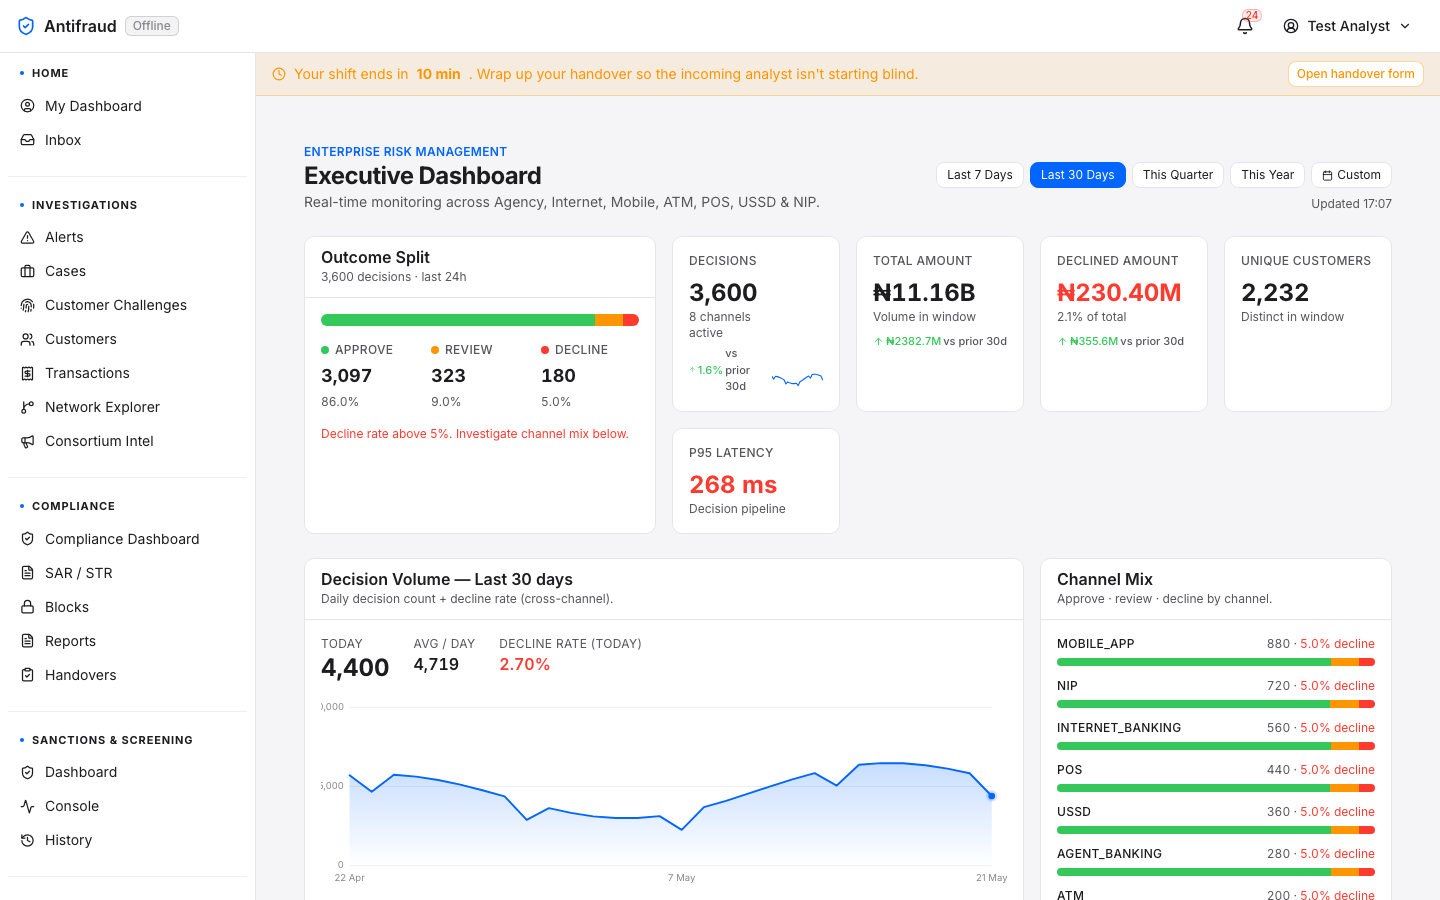
For users with system:admin or the admin role. Renders the same content as /dashboard — portfolio-level KPIs across every channel: Agency, Internet, Mobile, ATM, POS, USSD & NIP. Captured below with a logged-in admin so every band is populated with real data; the distinguishing feature from the standalone Executive Dashboard is that My Dashboard (not Executive Dashboard) is the active tab in the Home module submenu, with Home highlighted in the left sidebar — confirming the user landed on their personal home page.
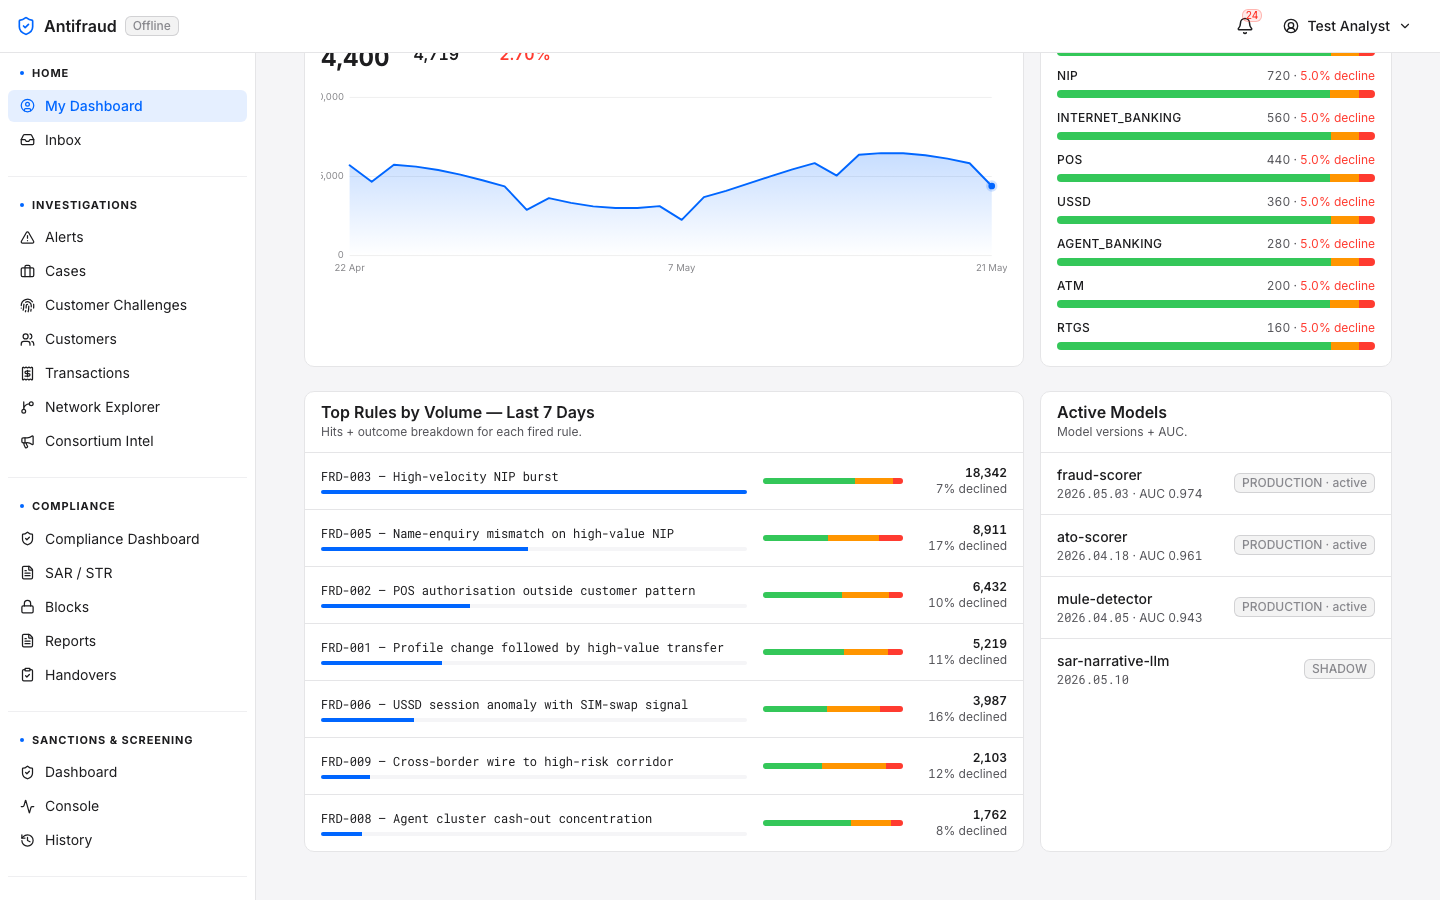
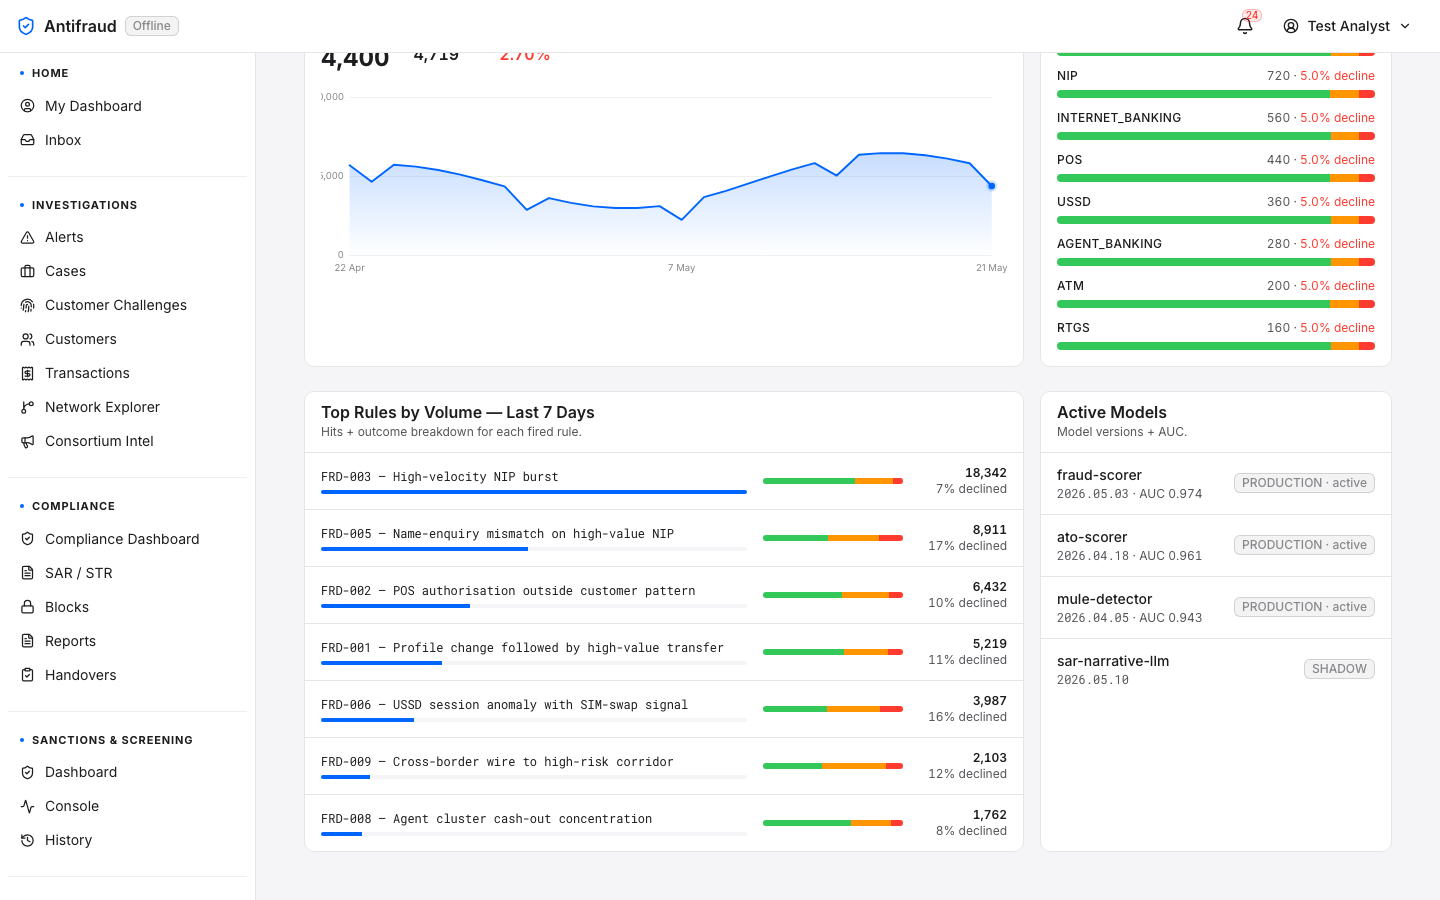
Figure 1.1a — Executive variant (top, admin view). Title Executive Dashboard under the Enterprise Risk Management eyebrow; period selector top-right (Last 7 Days · Last 30 Days selected · This Quarter · This Year · Custom) with "Updated 17:17" freshness stamp. First band — Outcome Split (3,600 decisions, last 24h — 3,097 approve at 86.0%, 323 review at 9.0%, 180 decline at 5.0%, with the inline guardrail "Decline rate above 5%. Investigate channel mix below." in red). KPI strip — Decisions 3,600 (8 channels active, +1.6% vs prior 30d), Total Amount ₦11.16B (vs ₦2382.7M prior 30d), Declined Amount ₦230.40M (2.1% of total · vs ₦355.6M prior 30d), Unique Customers 2,232, P95 Latency 268 ms on the decision pipeline. Second band — Decision Volume — Last 30 days with TODAY 4,400 · AVG/DAY 4,719 · DECLINE RATE (TODAY) 2.70% above a 30-day sparkline; Channel Mix bars (MOBILE_APP 880, NIP 720, INTERNET_BANKING 560, POS 440, USSD 360, AGENT_BANKING 280, ATM 200 — each with the 5.0% decline portion in red). My Dashboard is the active tab in the Home module submenu, with Home highlighted in the left sidebar.Figure 1.1a (continued) — Executive variant (bottom, admin view). The lower bands once the page has scrolled. Top Rules by Volume — Last 7 Days lists FRD-003 High-velocity NIP burst (18,342 hits, 7% declined), FRD-005 Name-enquiry mismatch on high-value NIP (8,911 / 17%), FRD-002 POS authorisation outside customer pattern (6,432 / 10%), FRD-001 Profile change followed by high-value transfer (5,219 / 11%), FRD-006 USSD session anomaly with SIM-swap signal (3,987 / 16%), FRD-009 Cross-border wire to high-risk corridor (2,103 / 12%), FRD-008 Agent cluster cash-out concentration (1,762 / 8%). Active Models card lists fraud-scorer 2026.05.03 (PRODUCTION · active · AUC 0.974), ato-scorer 2026.04.18 (PRODUCTION · active · AUC 0.961), mule-detector 2026.04.05 (PRODUCTION · active · AUC 0.943) and sar-narrative-llm 2026.05.18 (SHADOW — under evaluation). Channel Mix bars finish at the top-right with RTGS 160. My Dashboard remains the active tab in the Home module submenu, with Home highlighted in the left sidebar.
NoteFor the full anatomy of each band — what every tile means, what endpoint feeds it, and how to read the dashboard band-by-band — see the dedicated Executive Dashboard section. The two pages render the same component; only the route, the active submenu tab (and its module in the sidebar) and the entry point differ.
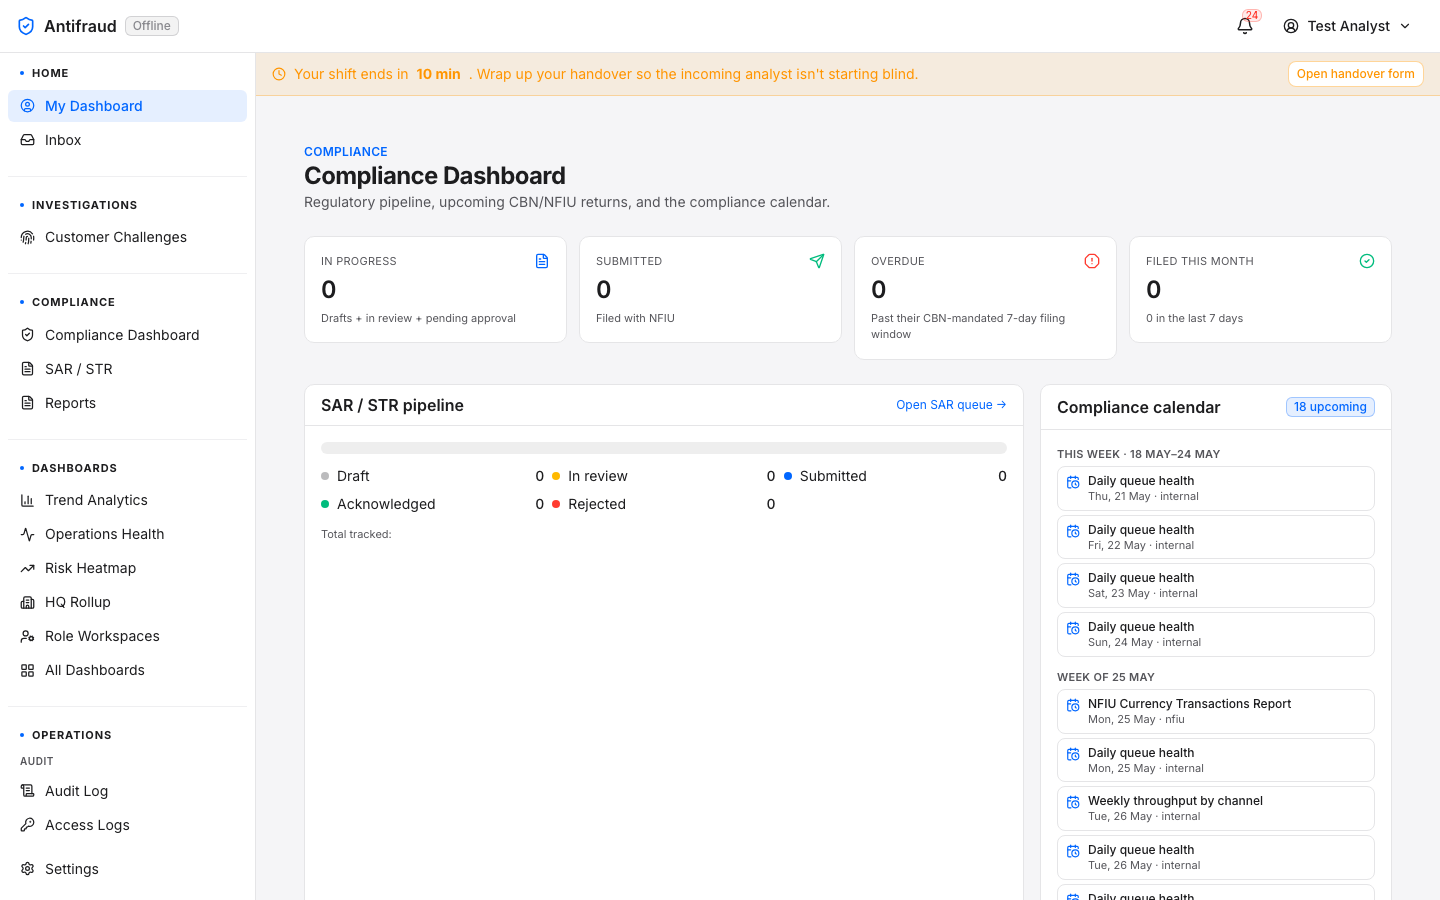
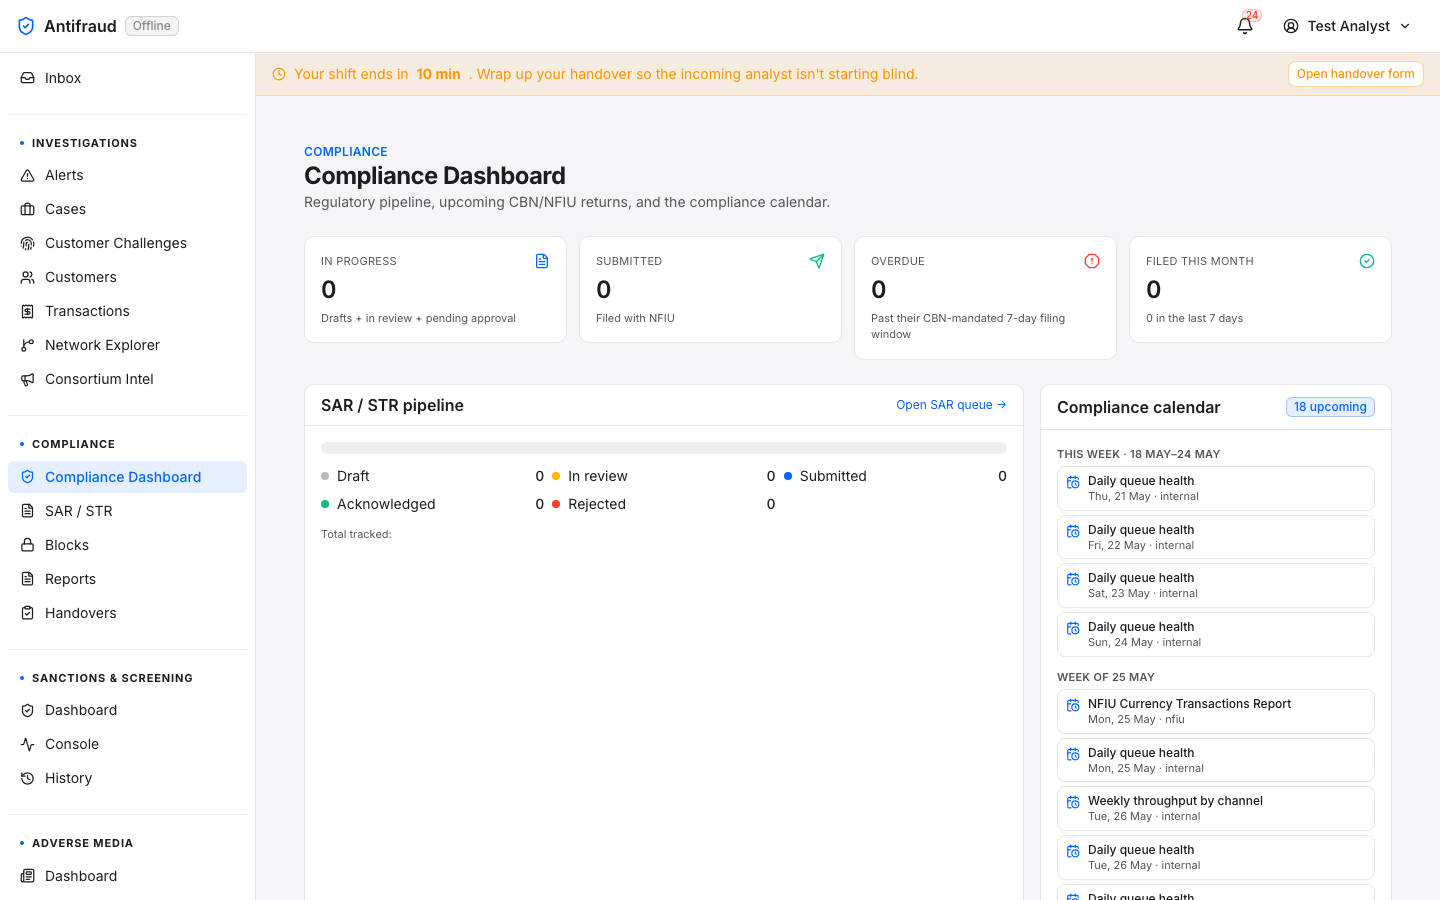
Variant 2 — Compliance
For users with the compliance_officer role or audit_log:read. Renders the same content as /compliance — the SAR/STR pipeline, the regulator schedule and the compliance calendar.
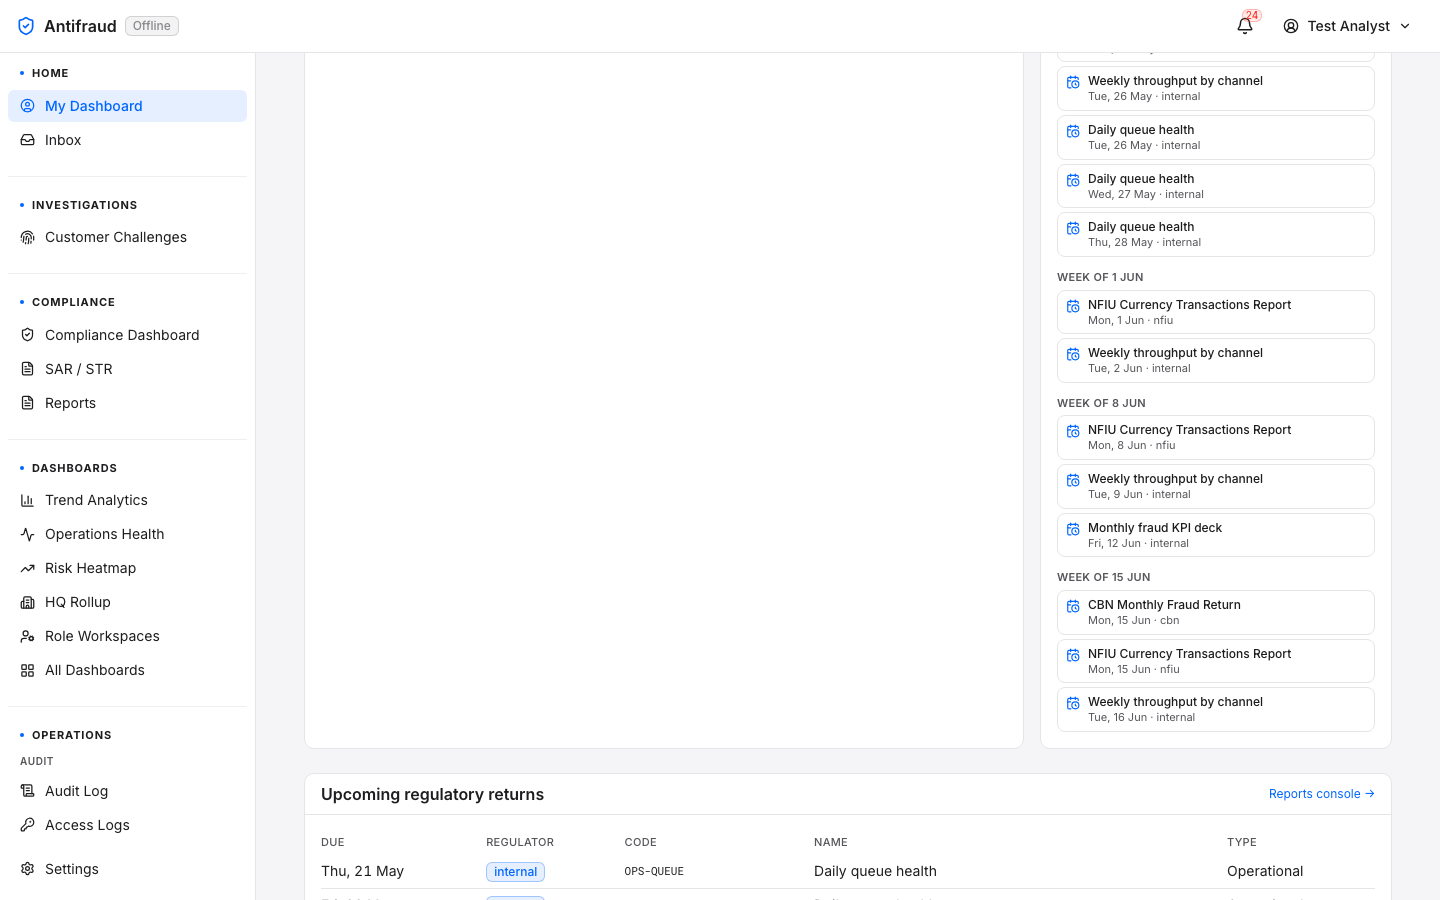
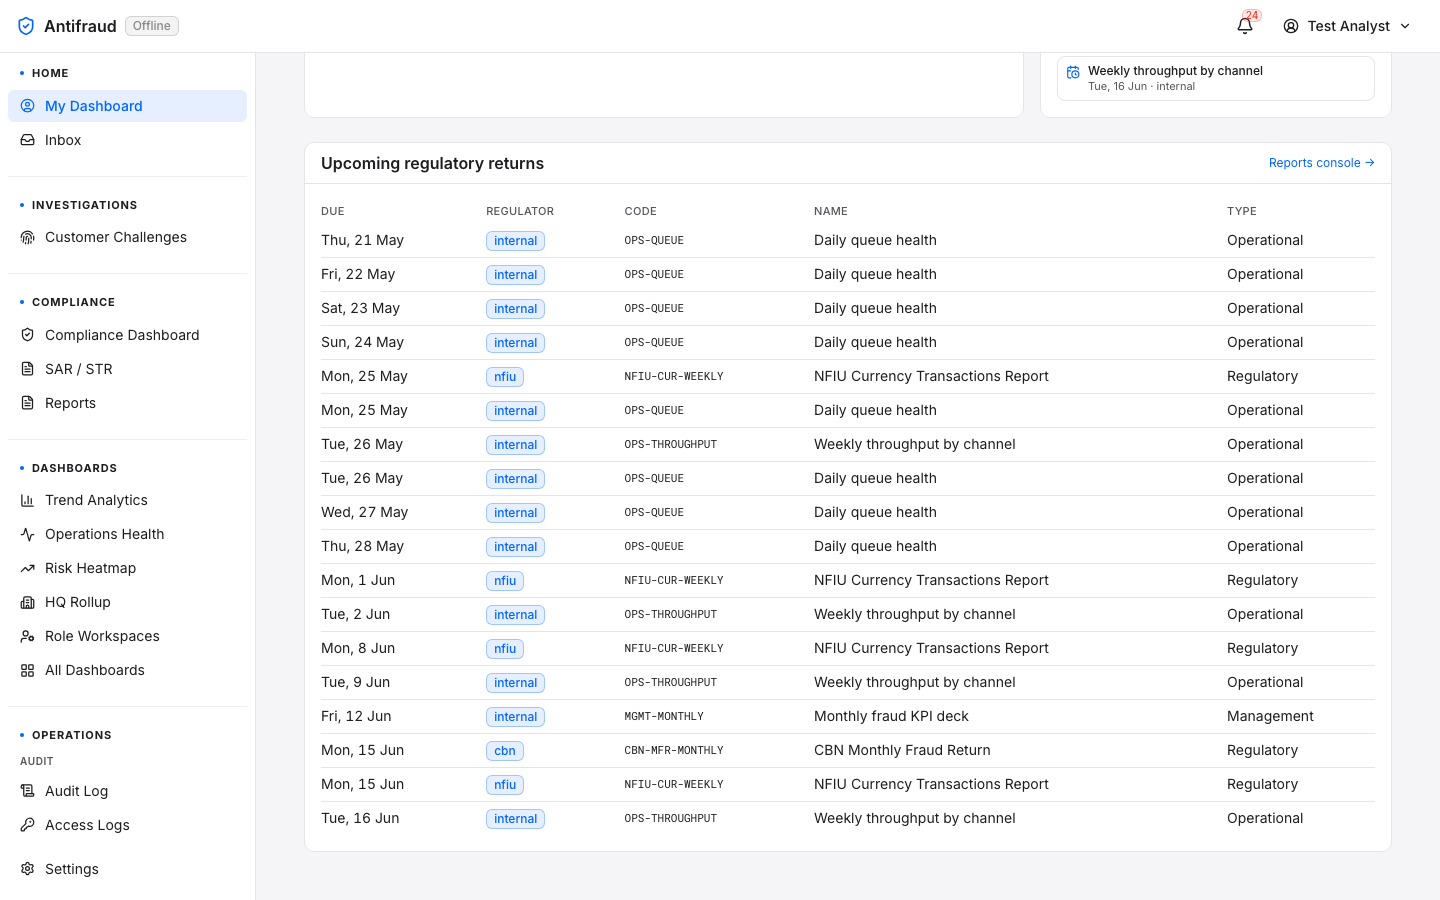
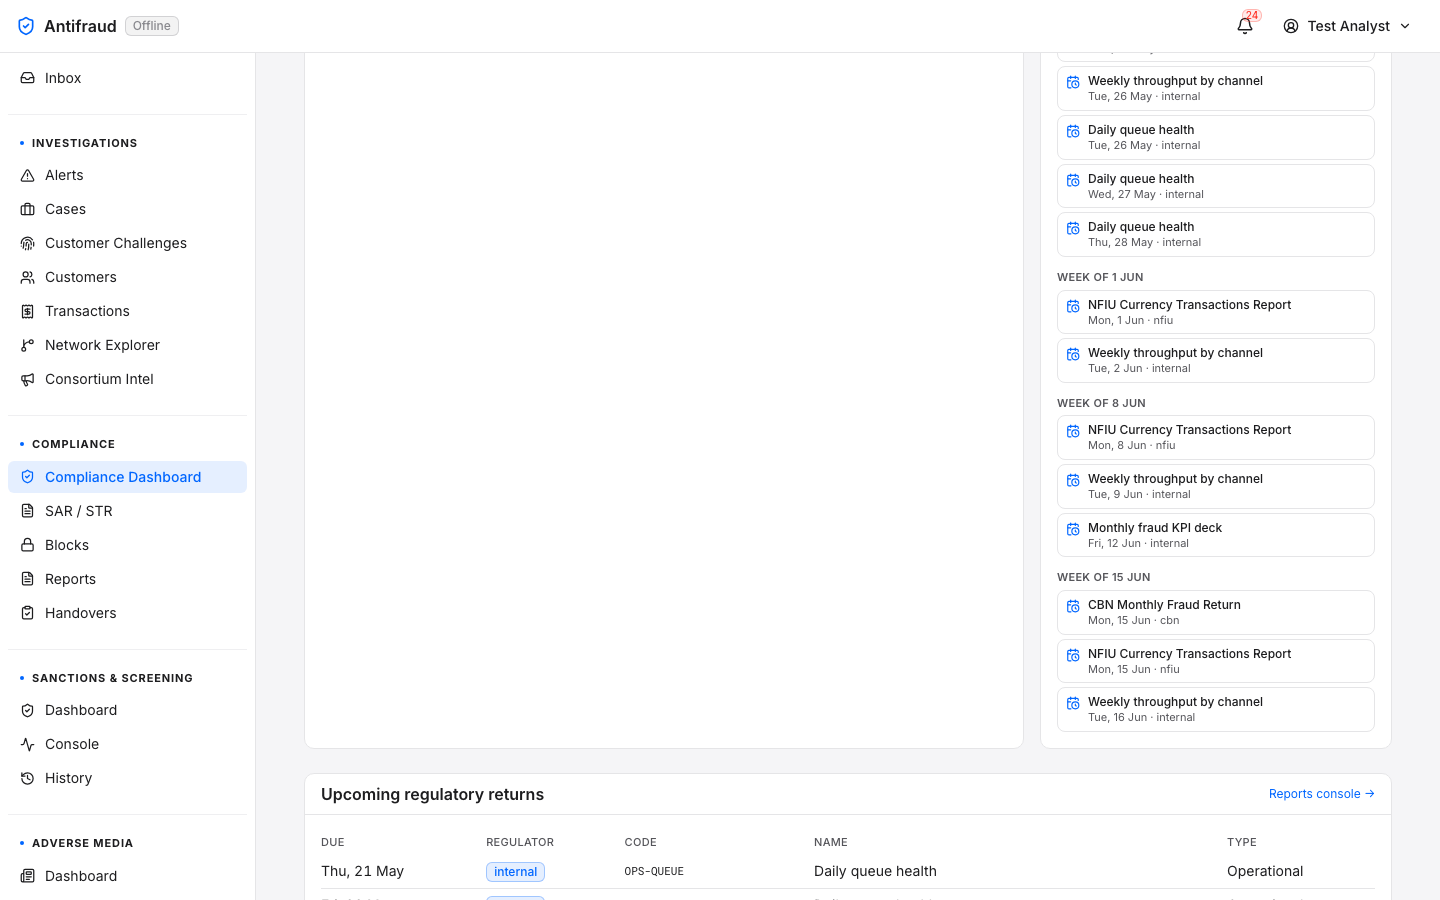
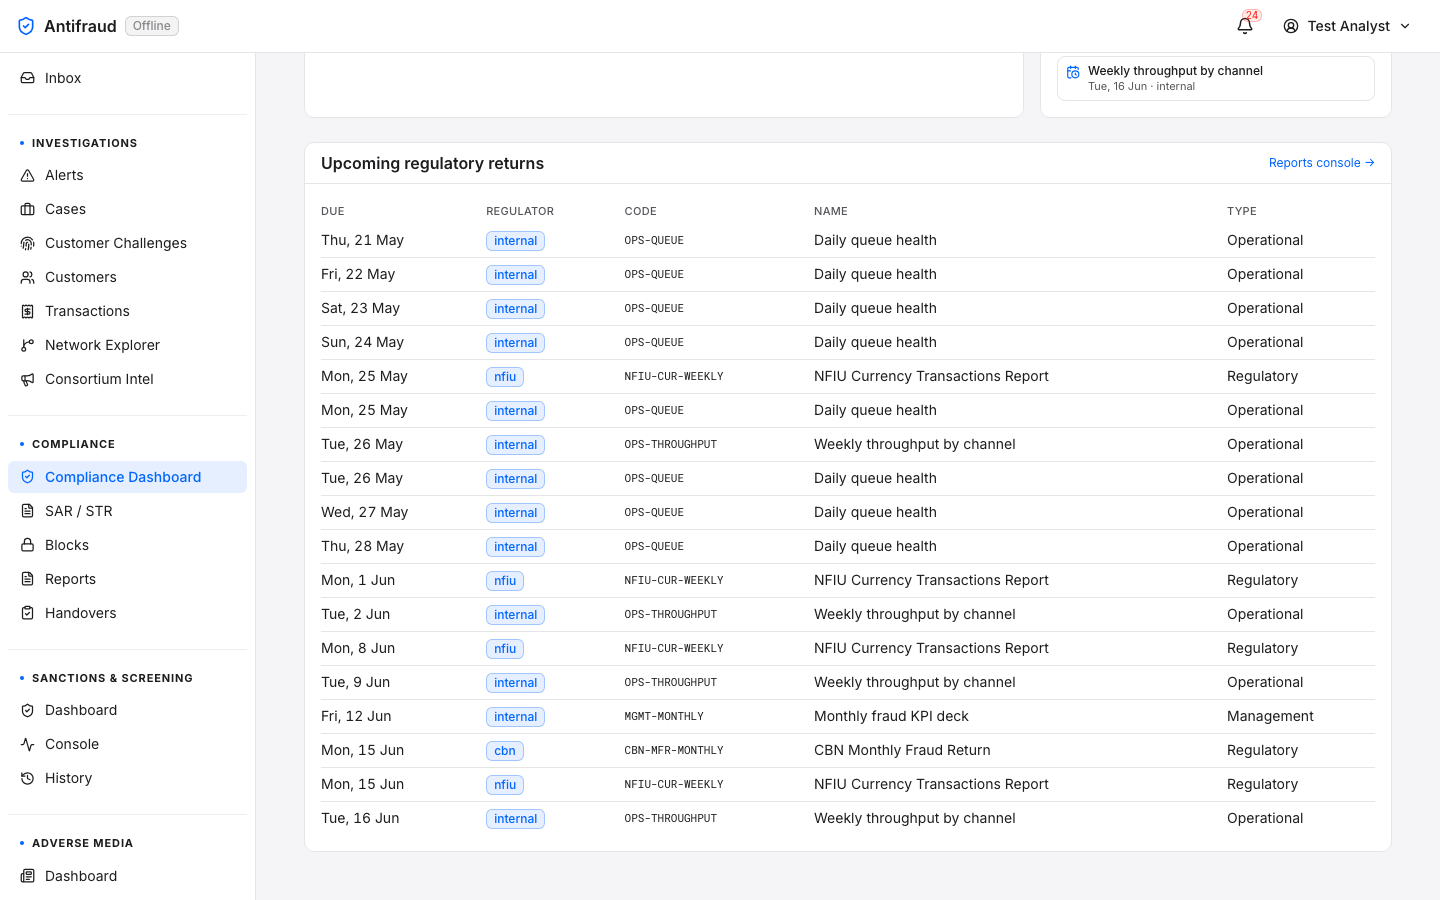
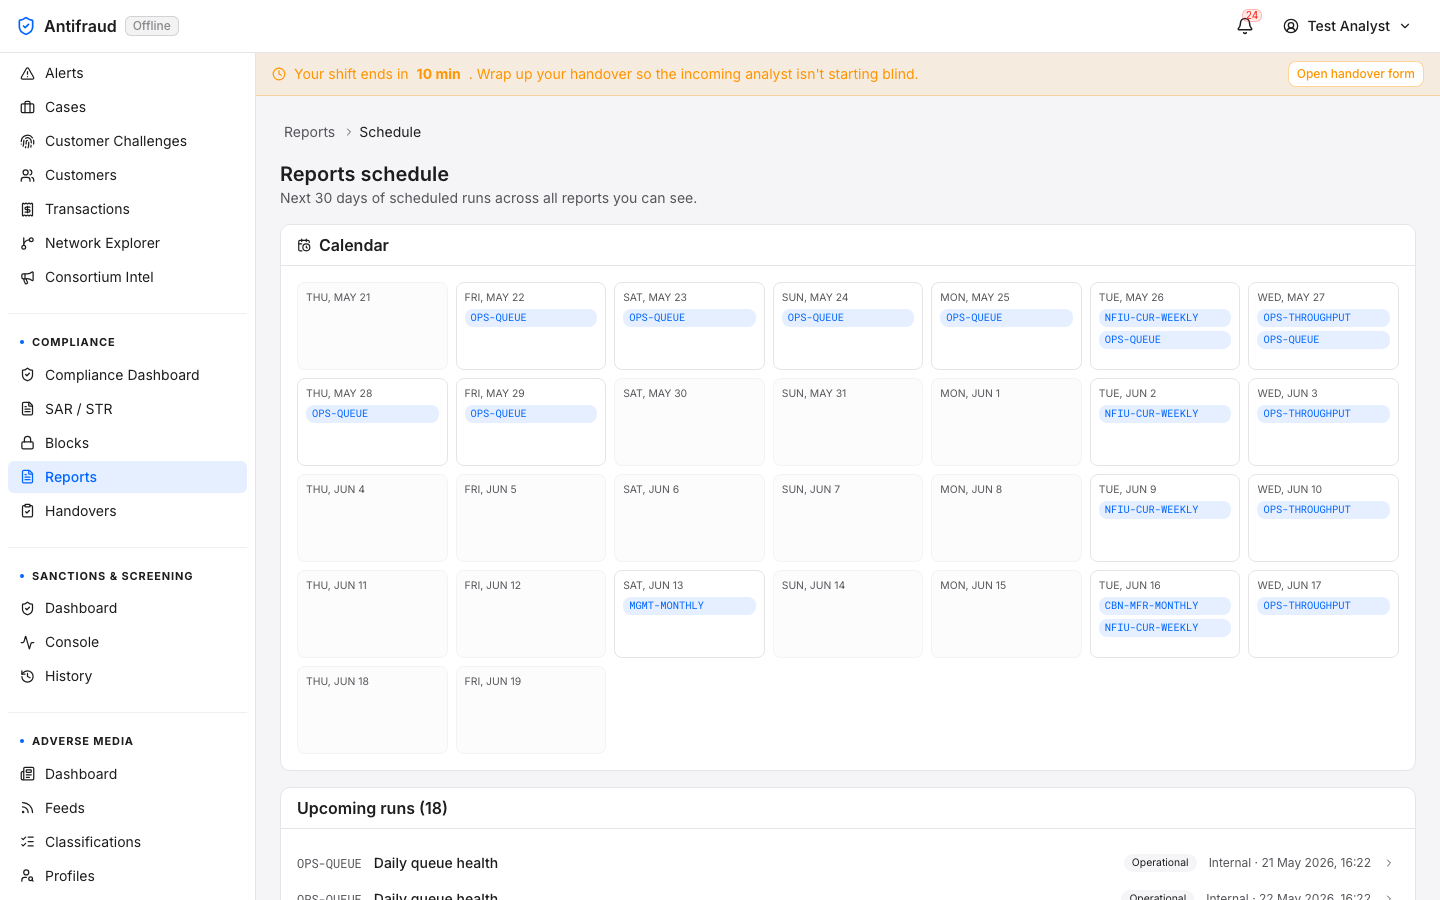
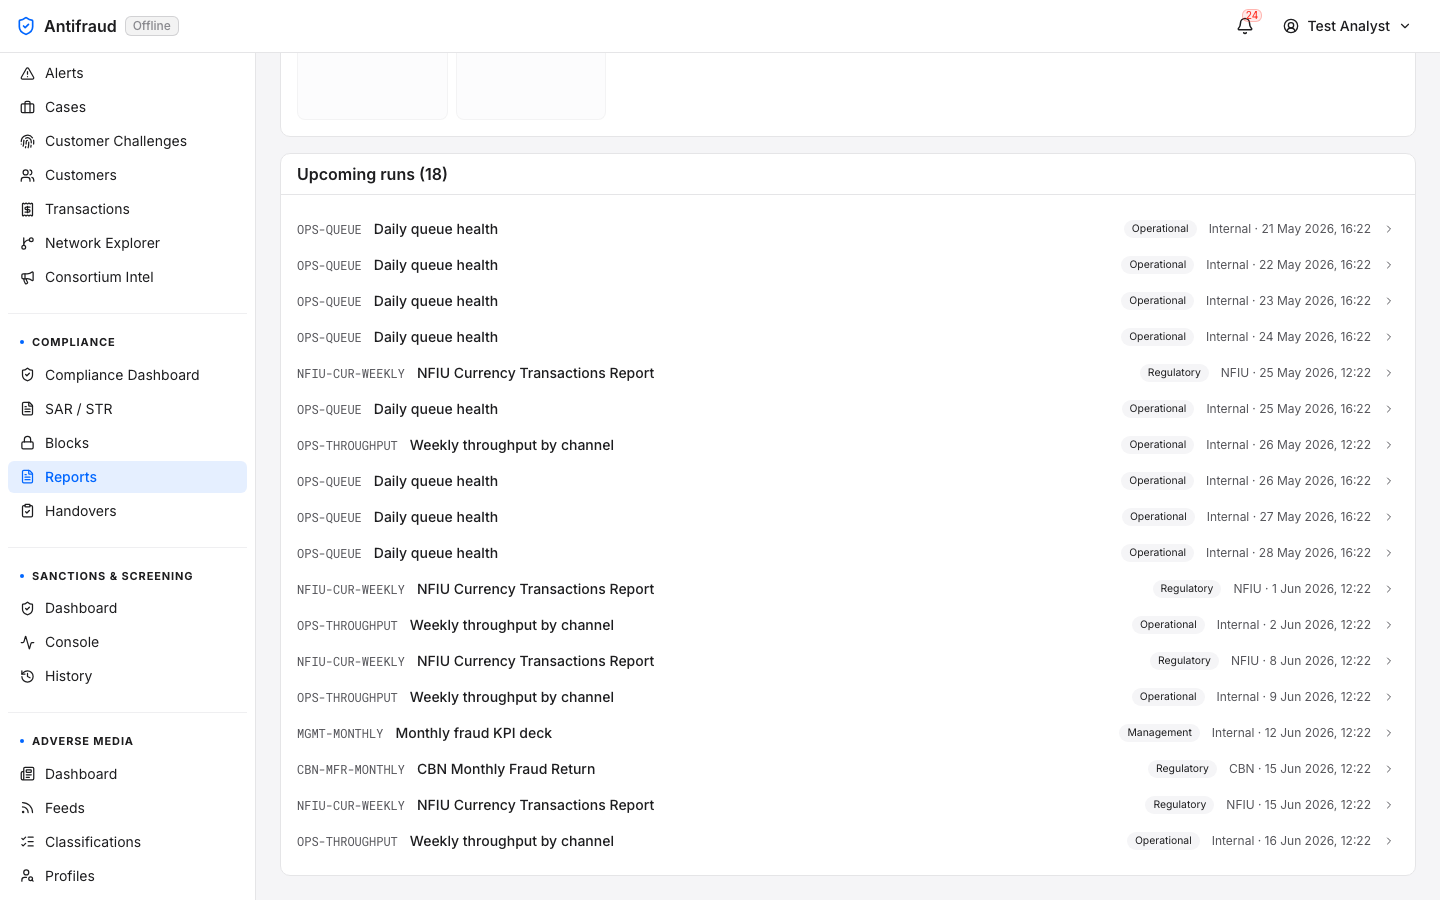
Figure 1.1b — Compliance variant (top). Four headline tiles: In Progress (drafts + in review + pending approval), Submitted (filed with NFIU), Overdue (past their CBN-mandated 7-day filing window) and Filed this month. Below, the SAR / STR pipeline funnel (Draft → In review → Submitted → Acknowledged → Rejected) and the Compliance calendar with the 18 upcoming items grouped by week.Figure 1.1c — Compliance variant (middle). The calendar continues into June with the recurring Daily queue health, Weekly throughput by channel, Monthly fraud KPI deck and the regulator-facing items (NFIU Currency Transactions Report, CBN Monthly Fraud Return). The Upcoming regulatory returns table starts at the bottom of the viewport.Figure 1.1d — Compliance variant (bottom). The Upcoming regulatory returns table in full — due date, regulator, code (OPS-QUEUE, NFIU-CTR, CBN-MONTHLY, …), name and type (Operational, Regulatory). The Reports console link in the top-right of the table jumps straight to the Reports catalogue.
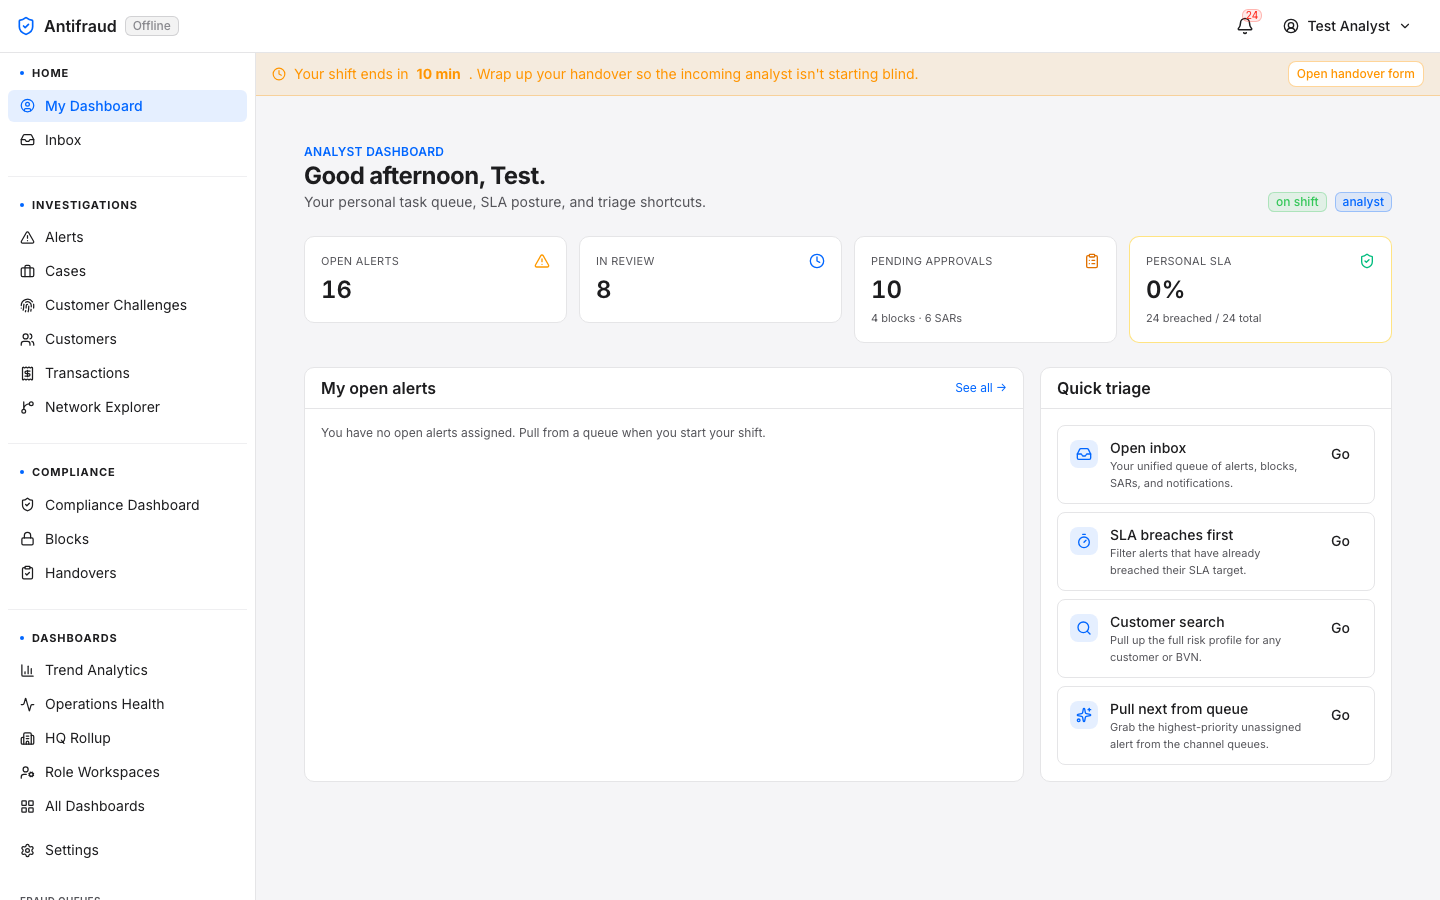
Variant 3 — Analyst
For users holding alerts:read or cases:read but not the elevated permissions above. The page answers a single question: "what is on my plate right now?"
Figure 1.1e — Analyst variant. A personalised greeting ("Good afternoon, Test.") with the on-shift and analyst chips top-right. Four personal counters: Open Alerts (16), In Review (8), Pending Approvals (10 — 4 blocks · 6 SARs) and Personal SLA (0% — 24 breached / 24 total, framed by a yellow attention border). Below: a "My open alerts" list (empty-state copy "Pull from a queue when you start your shift.") and Quick triage cards (Open inbox, SLA breaches first, Customer search, Pull next from queue) — each card has a one-click Go affordance straight to the right surface.
Variant 4 — Viewer welcome
For accounts that hold no analyst, compliance or admin permission — API integration accounts, observers, partner read-only users. Instead of rendering an empty dashboard, the page shows a welcome card and only the quick links the user's permissions actually let them open.
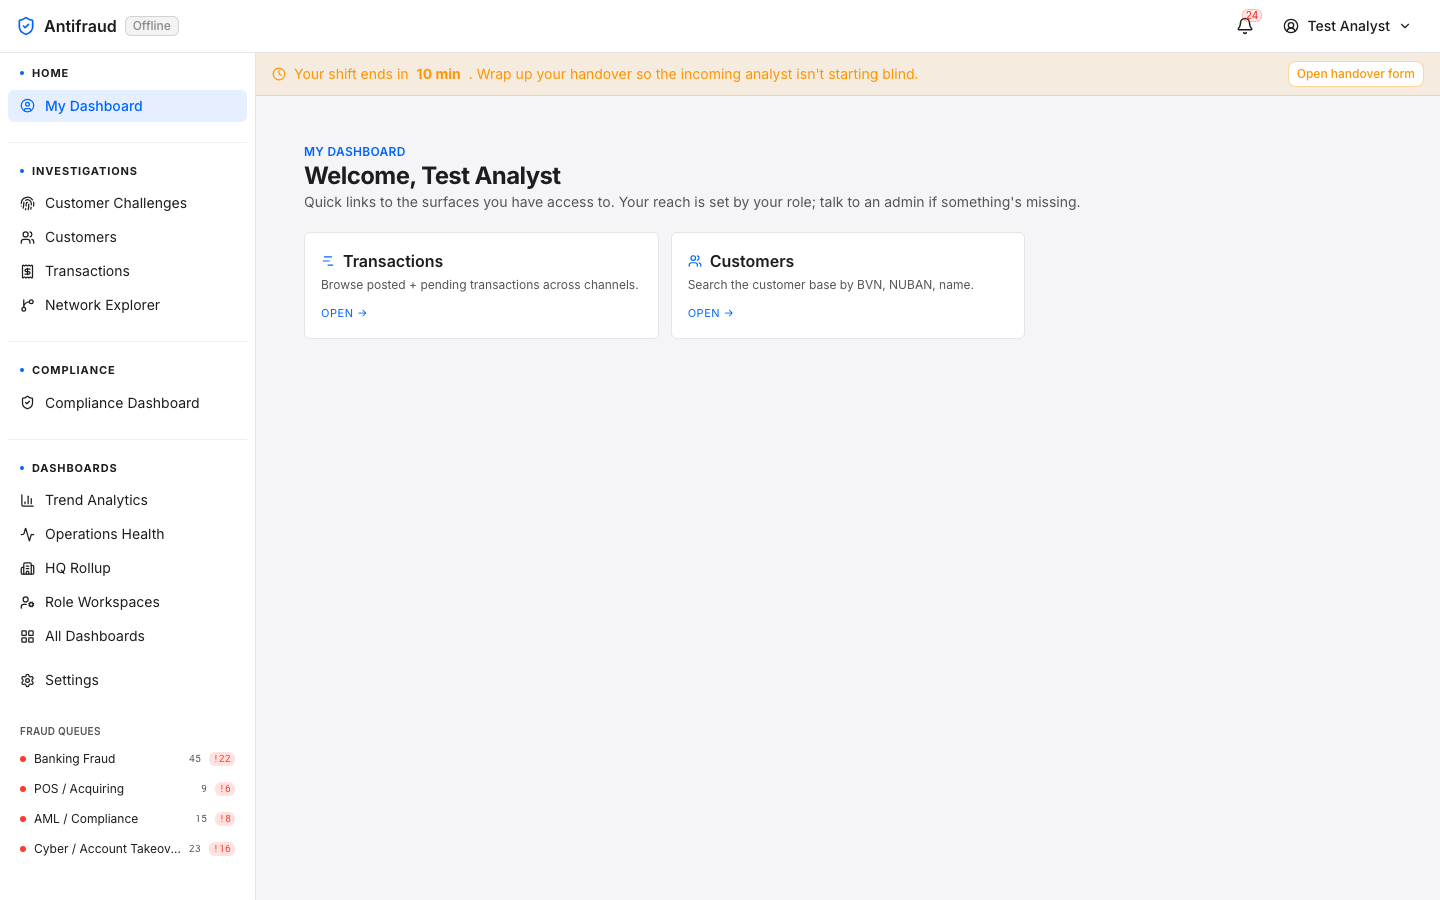
Figure 1.1f — Viewer welcome. "Welcome, Test Analyst — Quick links to the surfaces you have access to. Your reach is set by your role; talk to an admin if something's missing." The example principal holds transactions:read and customers:read, so only the Transactions and Customers tiles render. A principal with no surface permissions sees the welcome header alone — the platform never renders a grid of greyed-out cards.
Common chrome on every variant
Shift-end banner. The orange banner at the top of every page appears when the analyst's shift has less than ten minutes remaining and links straight to End-of-shift. It is dismissable per page but the shift clock keeps ticking and the banner returns on the next navigation.
Active navigation marker. While the user is on this page, "My Dashboard" is highlighted as the active tab in the Home module submenu and Home is highlighted in Kupinga blue in the left sidebar.
Real-time updates. Analyst counters refresh on the WebSocket alert/case events; the executive and compliance variants refresh on their own polling intervals (default 30s).
Empty states. Every tile that has nothing to show explains why. Empty is never the same shape as broken.
How to use it well
Land here first. Treat it as the homepage — the shape of what you see tells you what kind of day you have ahead.
Trust the chips. The on shift / analyst chips top-right of the analyst variant reflect your current state, not what you logged in as — if you handed shift but did not sign out, this is how you confirm.
Open one thing. Don't bounce between the Quick triage shortcuts. Open the inbox or pull the next alert and finish it before coming back.
Use the personal SLA tile as your priority signal. A 0% personal SLA in the analyst variant is the loudest warning the platform makes about you personally.
Permissions reference
Permission
Effect on My Dashboard
system:admin / admin role
Routes to Executive variant.
audit_log:read / compliance_officer role
Routes to Compliance variant (and unlocks the SAR / Reports / Audit log surfaces).
alerts:read / cases:read
Routes to Analyst variant.
Any of transactions:read, customers:read, blocks:read, reports:read, branches:read, teams:read
Renders a corresponding quick-link card on the Viewer welcome variant.
Operational notes
The route itself is gated by the same outer permission group as the rest of the Insights/Operations rollup. A principal who somehow has no permission in that family will see an "Access denied" card rather than the dashboard.
The analyst variant's "My open alerts" list shows your assigned alerts only — not everything in the queue. Use the Alerts queue to pull from the queue.
Counters can lag behind the real database by up to one polling cycle (30 seconds) during high-traffic periods. If two counters disagree, refresh the page.
"Personal SLA = 0%" with breaches > 0 means every one of your assigned items has missed its SLA. This is a coaching signal — talk to your team lead before continuing.
CautionThe executive and compliance variants surface portfolio-level numbers — board-room information. Treat the page like any other report containing PII: do not screen-share it without permission, and use the Print button on the underlying Executive Dashboard rather than camera-captures when an offline copy is needed.
TipIf your dashboard looks like the wrong variant, your role or permission set probably needs adjusting. Open the Settings hub for your current role and permissions, then contact your administrator — do not work around the wrong dashboard by deep-linking to the surface you expected.
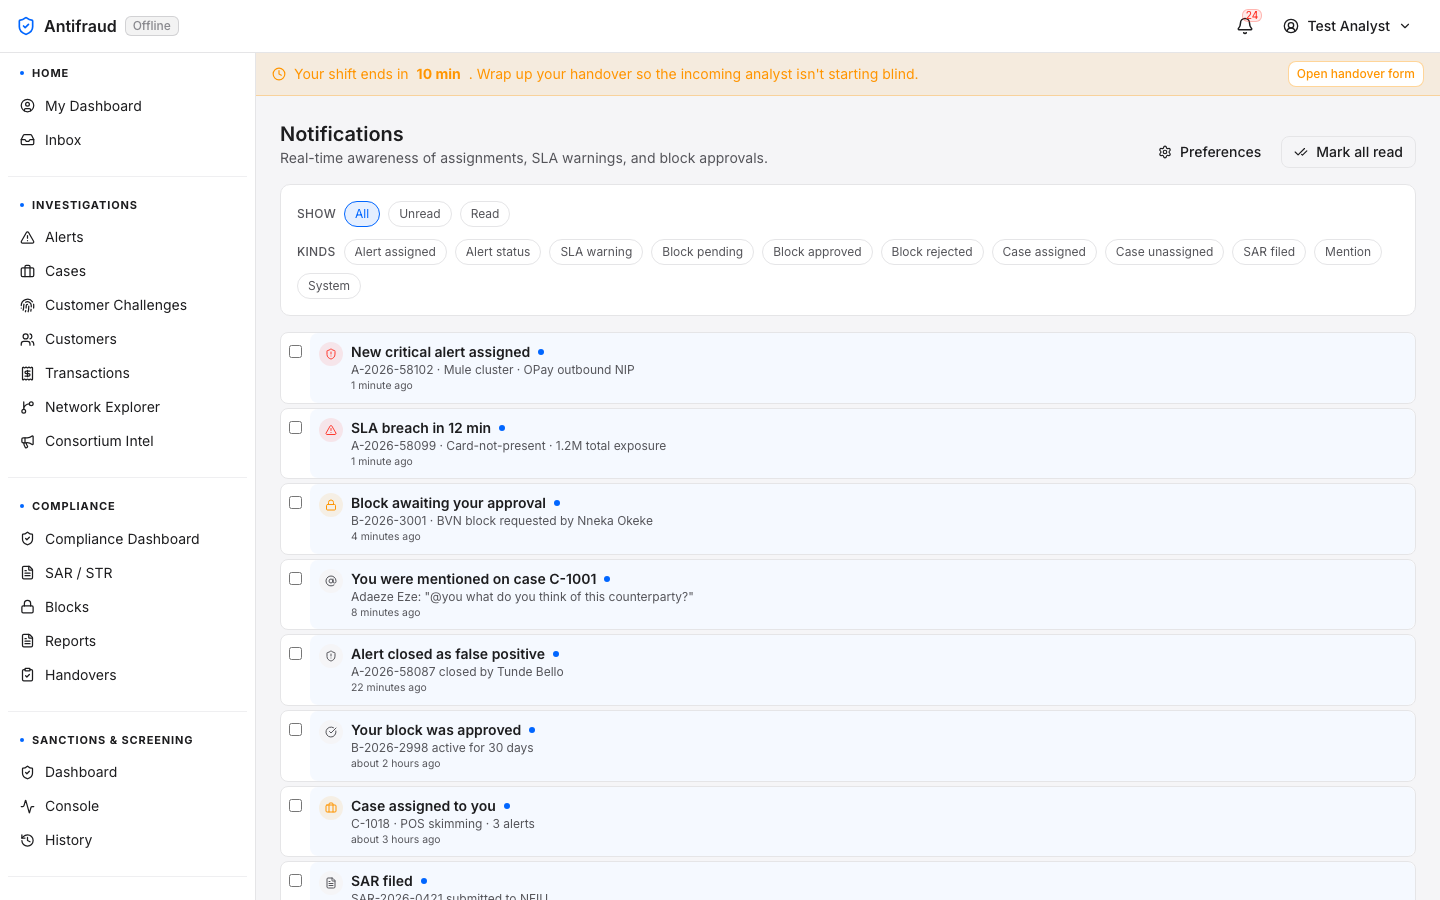
Unified Inbox
Inbox readers/inboxCanonical landing
Purpose
One queue that aggregates alerts, pending blocks, SAR reviews, handovers and notifications.
Audience
Any role with inbox:read. Analysts especially.
When to use
The first thing you open. Triage everything that needs your attention without switching pages.
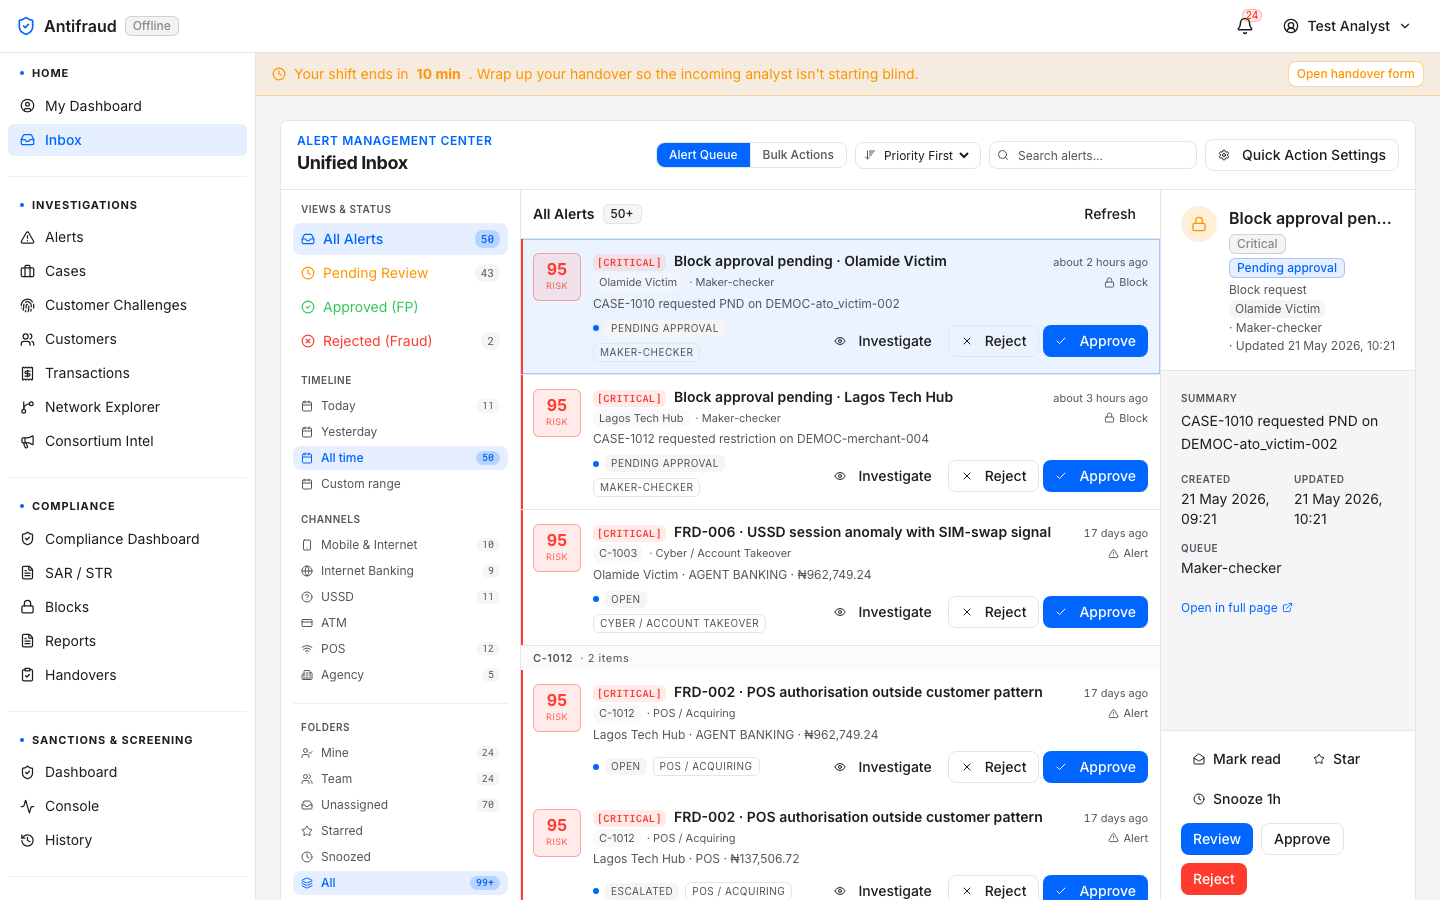
Figure 1.2 — Unified Inbox. Three-pane workspace: list of items on the left, focused item in the middle, contextual details on the right. Inbox is the active tab in the Home module submenu, with Home highlighted in the left sidebar.
Why this exists
Without the Inbox, an analyst would have to check four separate queues every morning — alerts, block approvals, SAR reviews waiting for sign-off and overnight notifications. The Inbox merges all of them into one ranked list so nothing is forgotten. Items are sorted by SLA proximity and severity.
Key actions
Click an item in the left column to focus it. The middle pane shows the workspace; the right pane shows context (history, related cases, similar items).
Press j / k to walk through items without taking your hands off the keyboard.
Decide, escalate or hand off from the action bar. Every decision lands in the Audit log immediately.
Permissions
Visibility of an item is gated by the underlying resource permission — an analyst without sars:read will not see SAR review items in the Inbox even if they otherwise have inbox:read.
TipThe Inbox is the recommended landing page for analyst roles. Configure it as the default route from the Settings hub.
Investigations
The analyst's daily lane: alerts, cases, customers, transactions, and the relationships between them.
Investigations is where fraud is found, evidenced and acted on. Alerts arrive from the rules engine and the ML models; analysts triage them into cases; cases hold the chain of evidence; customers and transactions are the anchors. Network Explorer and Consortium Intelligence widen the lens beyond the institution.
This section is the busiest part of the platform for the average user. Every page below is designed to keep keyboard-driven analysts fast: predictable layouts, consistent action bars, copy-on-click identifiers, and SLA banding everywhere.
Alerts queue
Analysts/alertsReal-time
Purpose
Stream of all fraud alerts awaiting triage, with filters, queues, and SLA bands.
Audience
Anyone with alerts:read.
When to use
Every shift — this is where alerts that have not yet been picked up live.
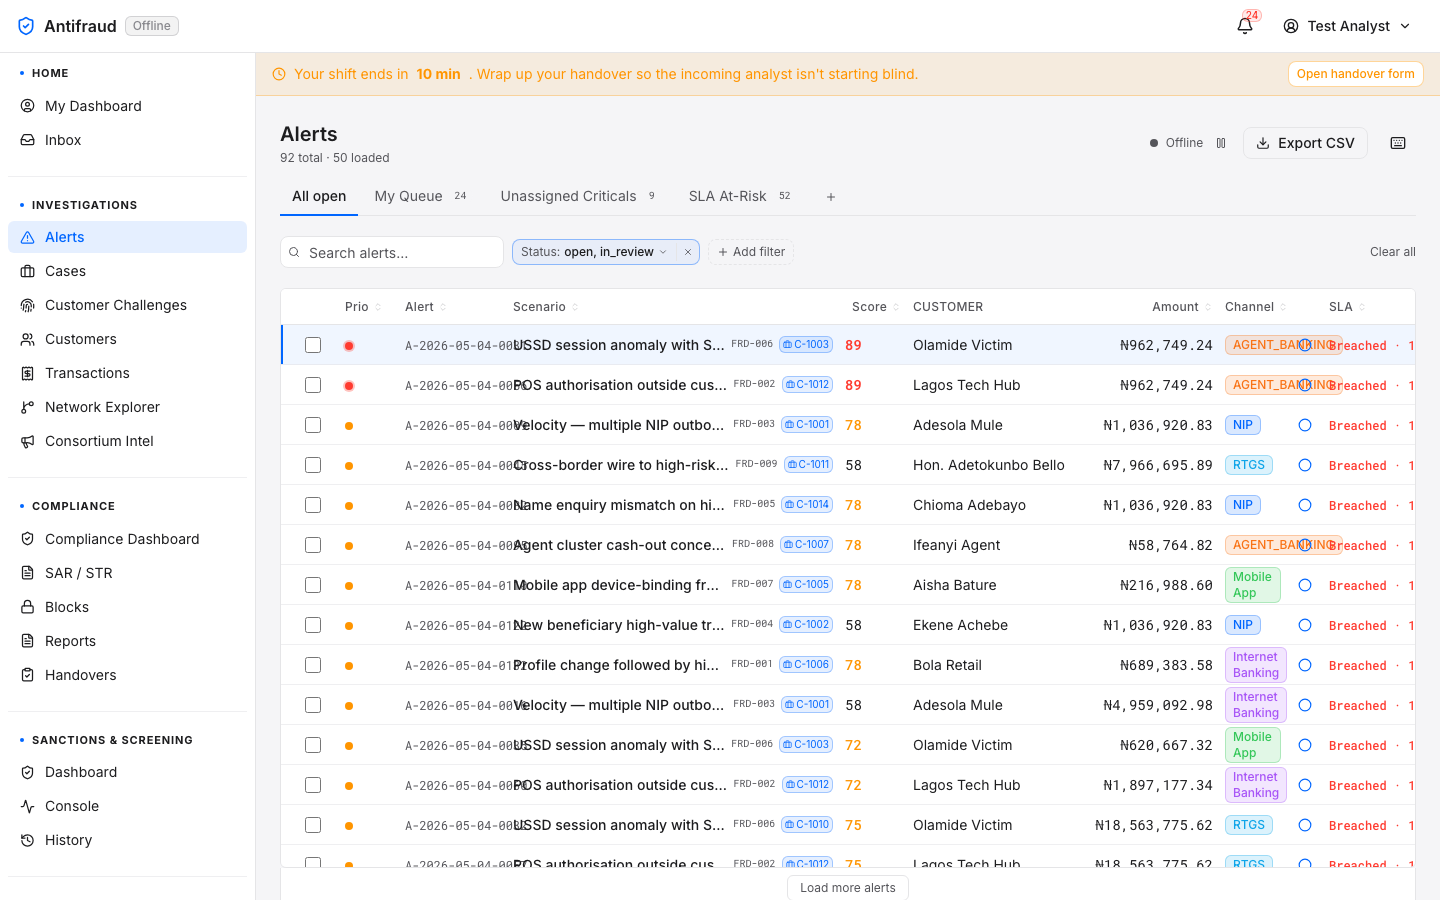
Figure 2.1 — Alerts queue. Filter strip across the top (All open, My Queue, Unassigned Critical, SLA At-Risk), table of alerts below, fraud-queue counts in the left rail. Alerts is the active tab in the Investigations module submenu, with Investigations highlighted in the left sidebar.
Key columns
Column
Meaning
Priority
Critical · High · Medium · Low. Drives queue sort order and SLA budget.
Scenario
The rule or scenario that fired (e.g. FRD-001 Profile change followed by high-value transfer).
Review the rationale strip and the underlying transaction.
Pivot to Customer 360 for context if the alert is not self-evident.
Decide: Approve, Decline, Escalate to case, Step-up customer, or Block.
Filters
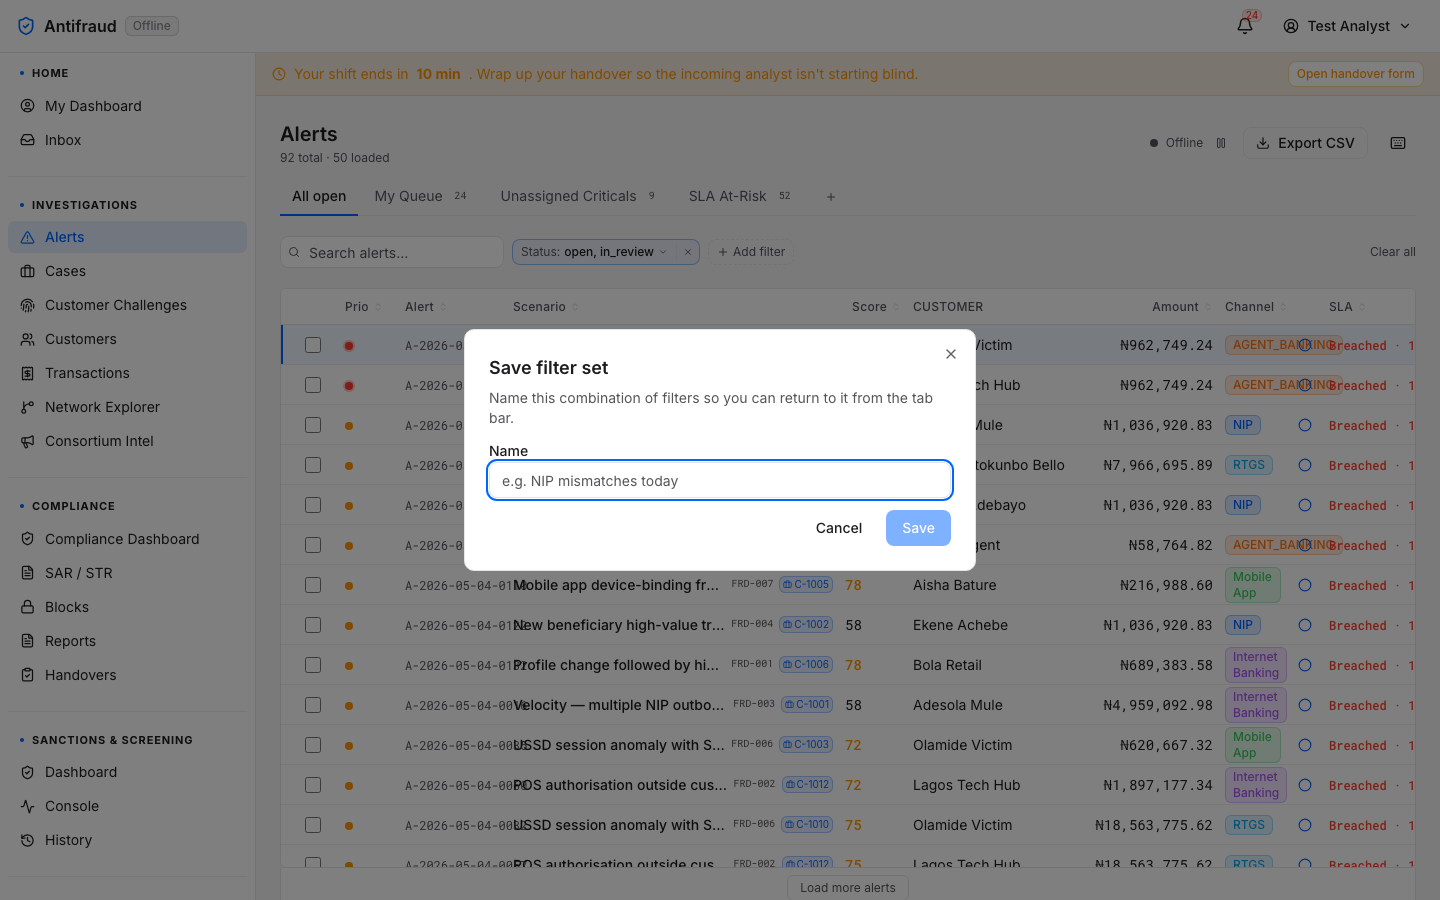
Figure 2.2 — Filter panel (when opened). Narrow by channel, scenario, priority, queue, SLA band and time window. Filters compose; multi-select widens the result set.
Business rules
Alerts are deduplicated by the platform — repeated firings against the same underlying activity within a configurable window are folded into one row to keep the queue scannable.
SLA budgets come from the SLA policy — critical alerts default to 15 minutes; lower priorities have longer budgets.
Decisions are append-only — the audit trail records every state change with the analyst's identity, the timestamp, and the rationale, and cannot be edited.
CautionDecisions made on alerts feed back into the Closed-loop feedback store and influence future model training. Snap decisions degrade model quality across the platform.
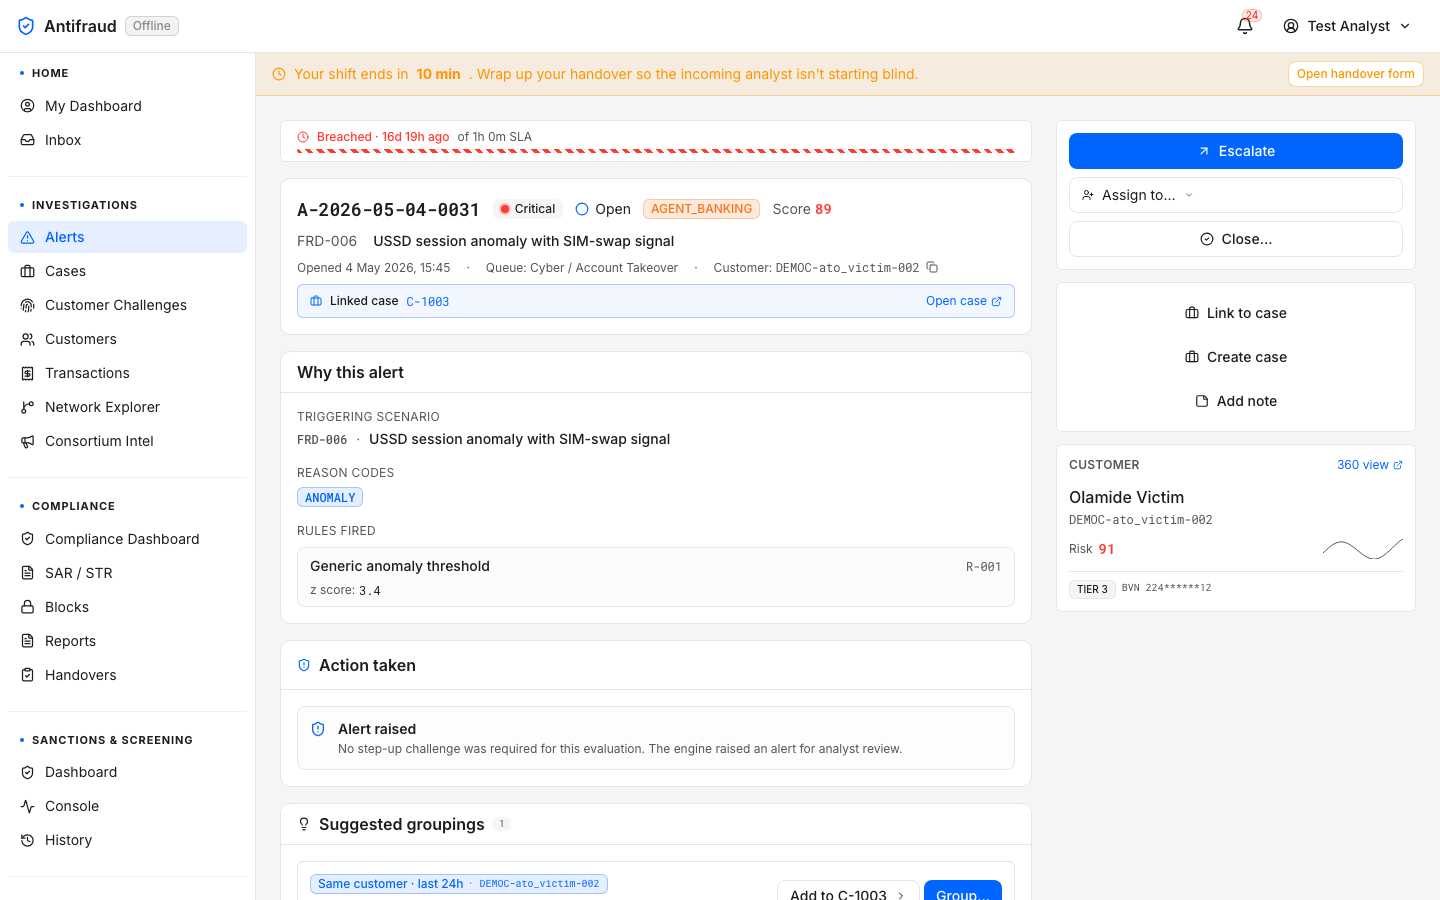
Alert detail & review
Analysts/alerts/<id>
The alert workspace is where most of the daily decisions are made. It surfaces the underlying transaction, the rule rationale, the customer profile, the device and channel signals, and the buttons that record the decision.
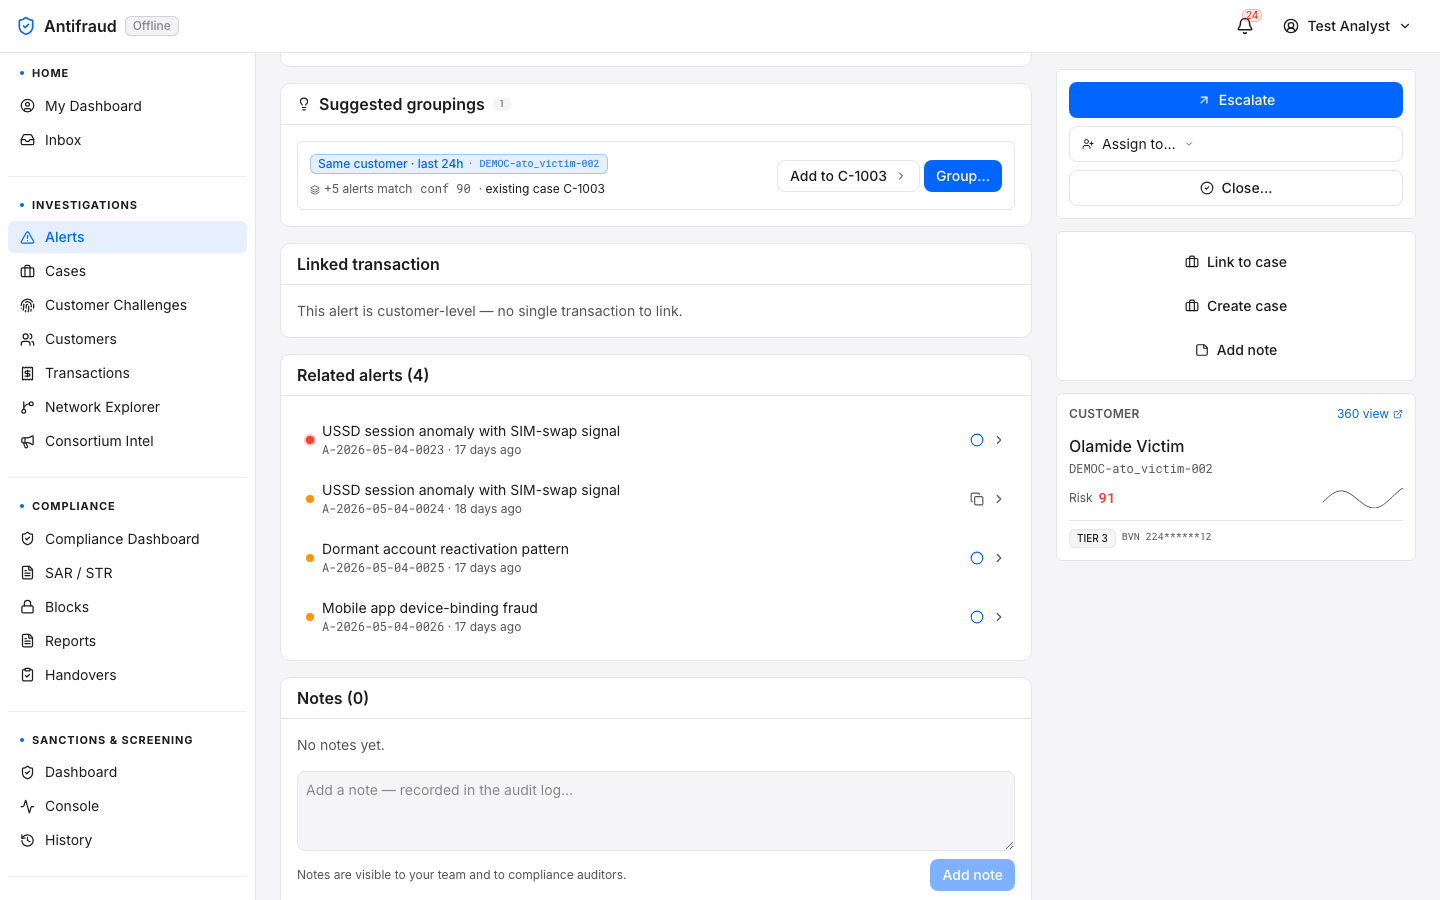
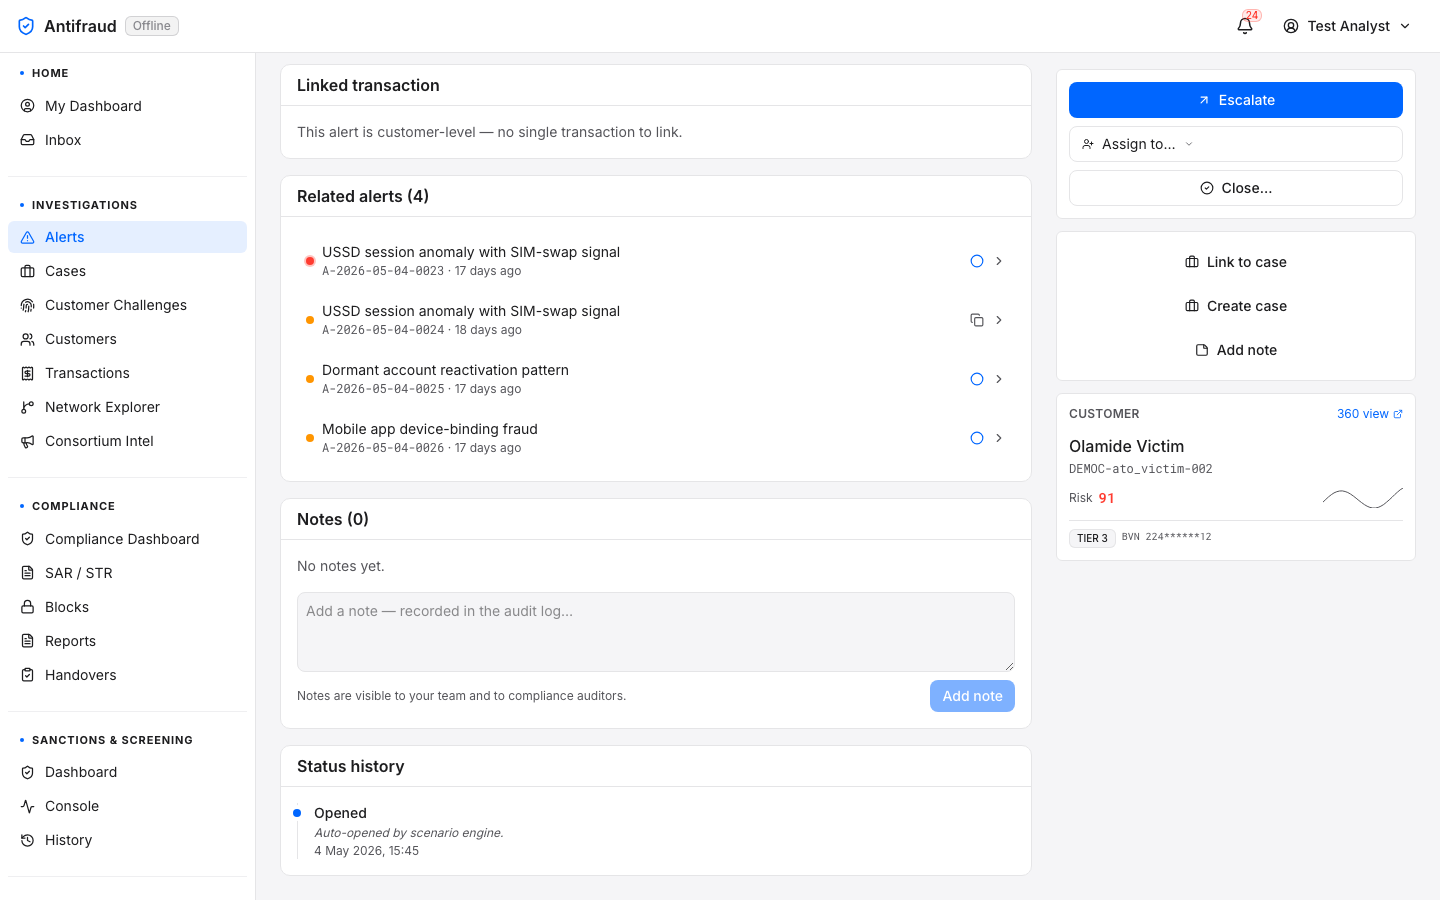
Figure 2.3a — Alert detail (top). Header strip with priority, SLA, queue and assignee; rationale panel; underlying transaction summary.Figure 2.3b — Alert detail (middle). Customer summary card, related signals, device fingerprint context.Figure 2.3c — Alert detail (bottom). Decision action bar, comment thread and audit trail.
Decisions available
Decision
What it does
Permission
Approve
Close the alert as not fraud. The underlying transaction proceeds.
alerts:decide
Decline
Block the underlying transaction. May produce a customer challenge.
Open the block request form pre-populated with the customer and rationale.
blocks:request
CriticalThe Decline and Place Block actions affect customers directly. If you are unsure, escalate to a case rather than declining outright — declining cannot be undone without manual rollback by an administrator.
Common mistakes
Approving an alert without leaving a rationale in the comment thread. Future audits cannot reconstruct why the decision was made.
Escalating to case when a step-up challenge would have resolved the suspicion in two minutes.
Decline-then-undo loops. The platform tracks these and the analyst's quality score drops — repeated occurrences trigger a coaching review from the team lead.
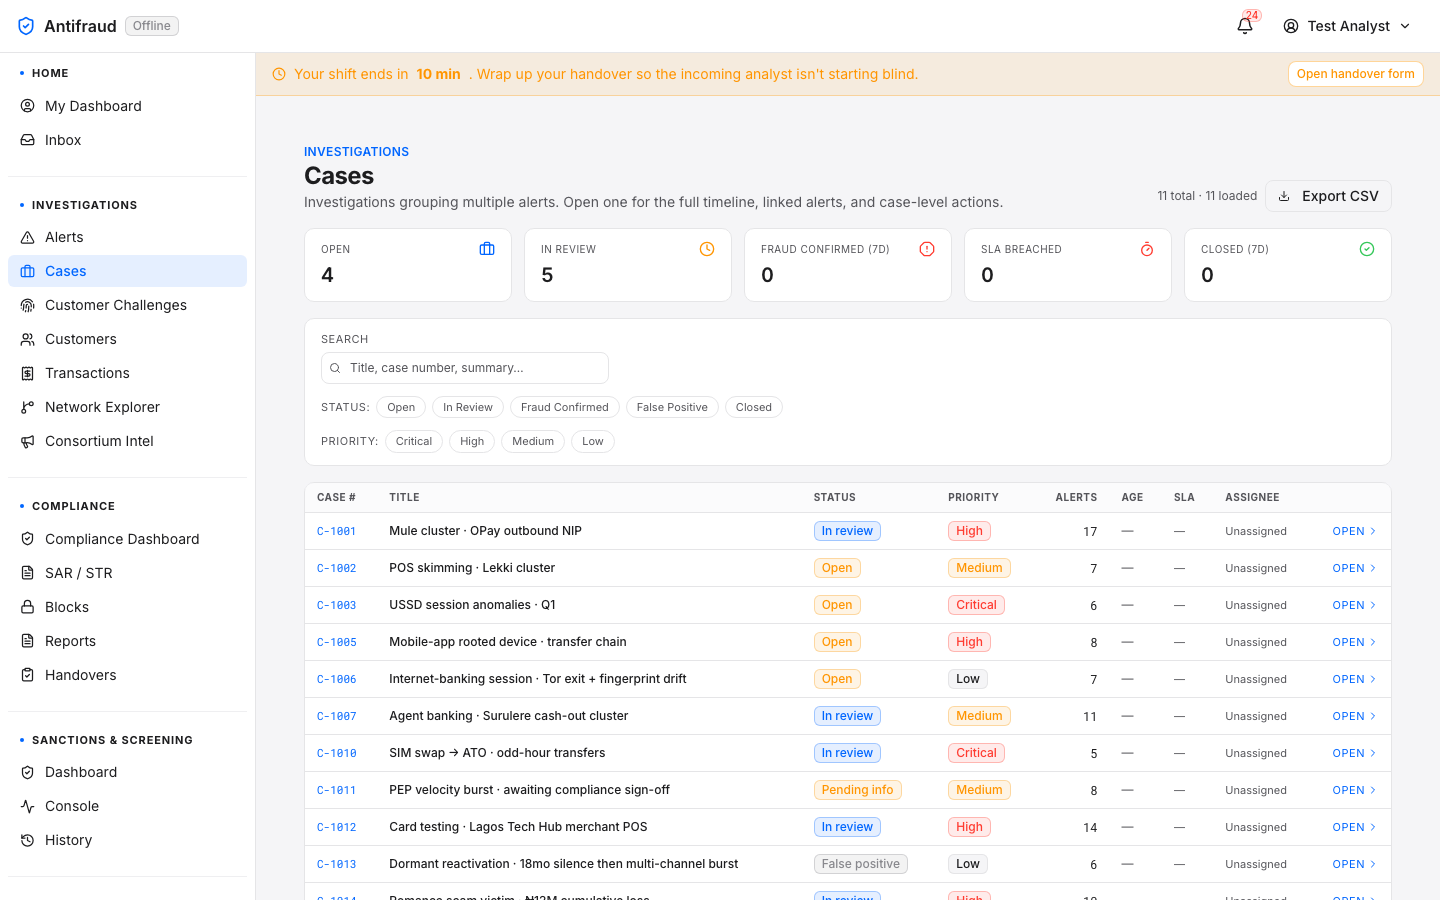
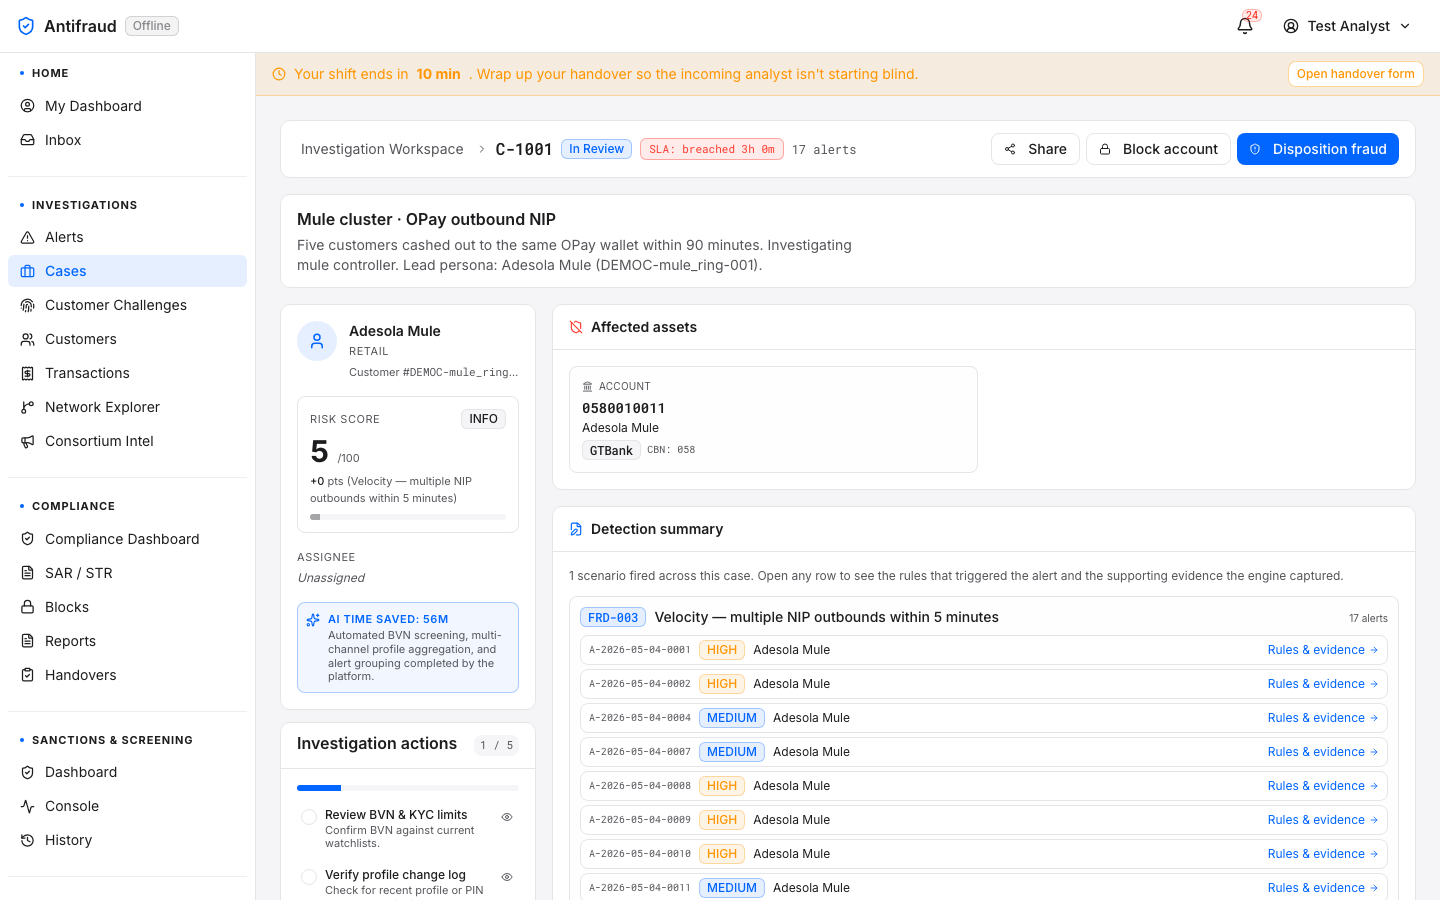
Cases list
Analysts/cases
A case is the durable container for an investigation. It holds alerts, transactions, customers, evidence, comments, decisions, and any SAR or block raised from it. The Cases list is the queue of investigations that are not yet closed.
Figure 2.4 — Cases list. Open cases grouped by team and SLA band. Click a case ID to drill in.
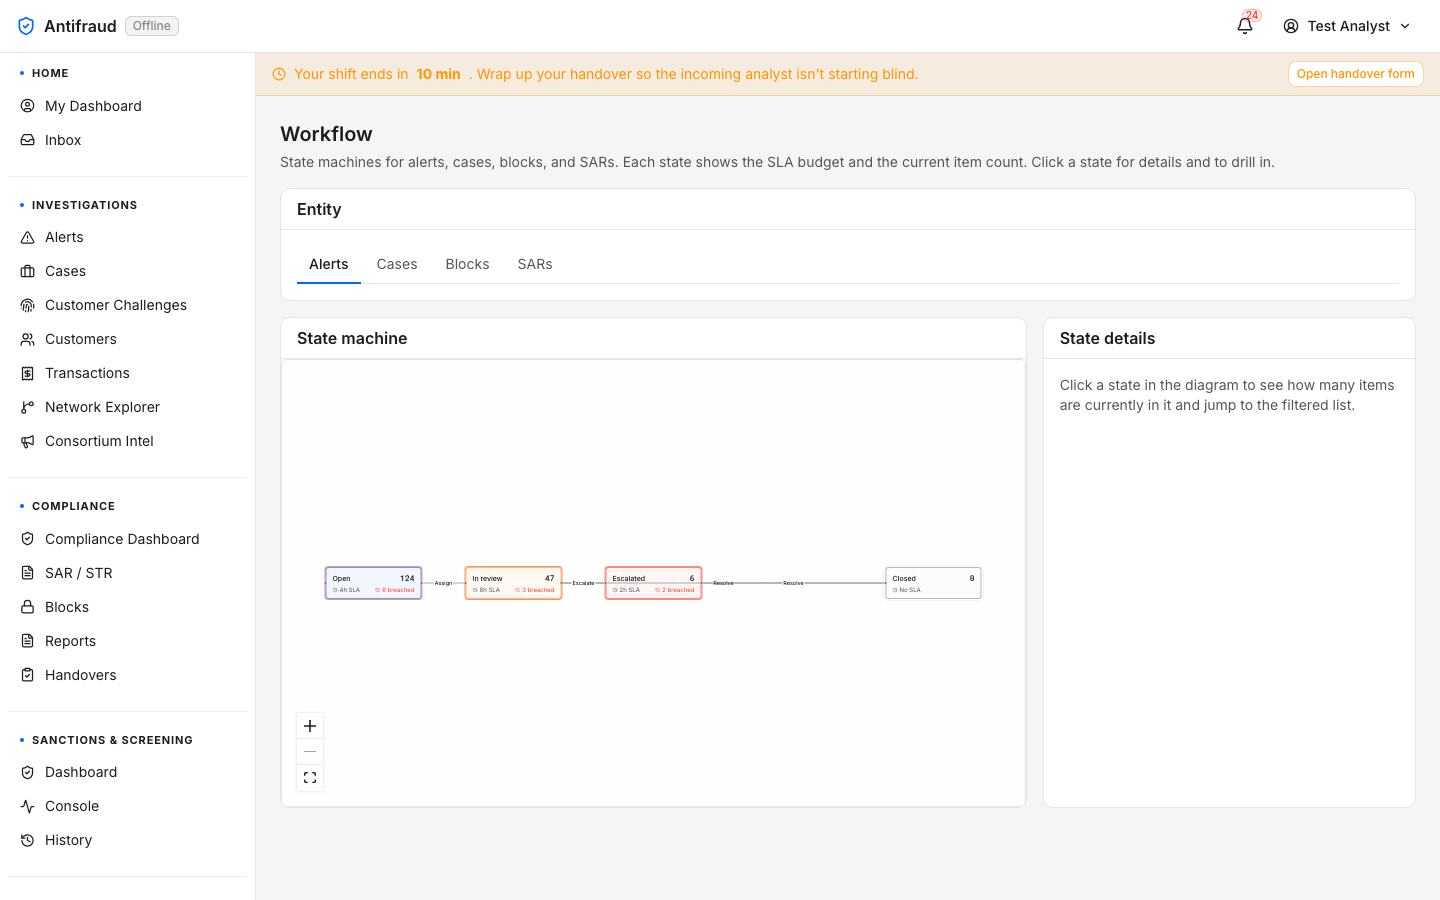
Case lifecycle
Cases progress through a fixed state machine: New → In review → Awaiting customer → Pending closure → Closed. The state machine is rendered visually on the State machine view page.
Filters
Owner — your cases vs the team's vs unassigned.
State — only New, only In review, etc.
Scenario — group by the originating rule or model.
SLA — surface cases that are about to breach.
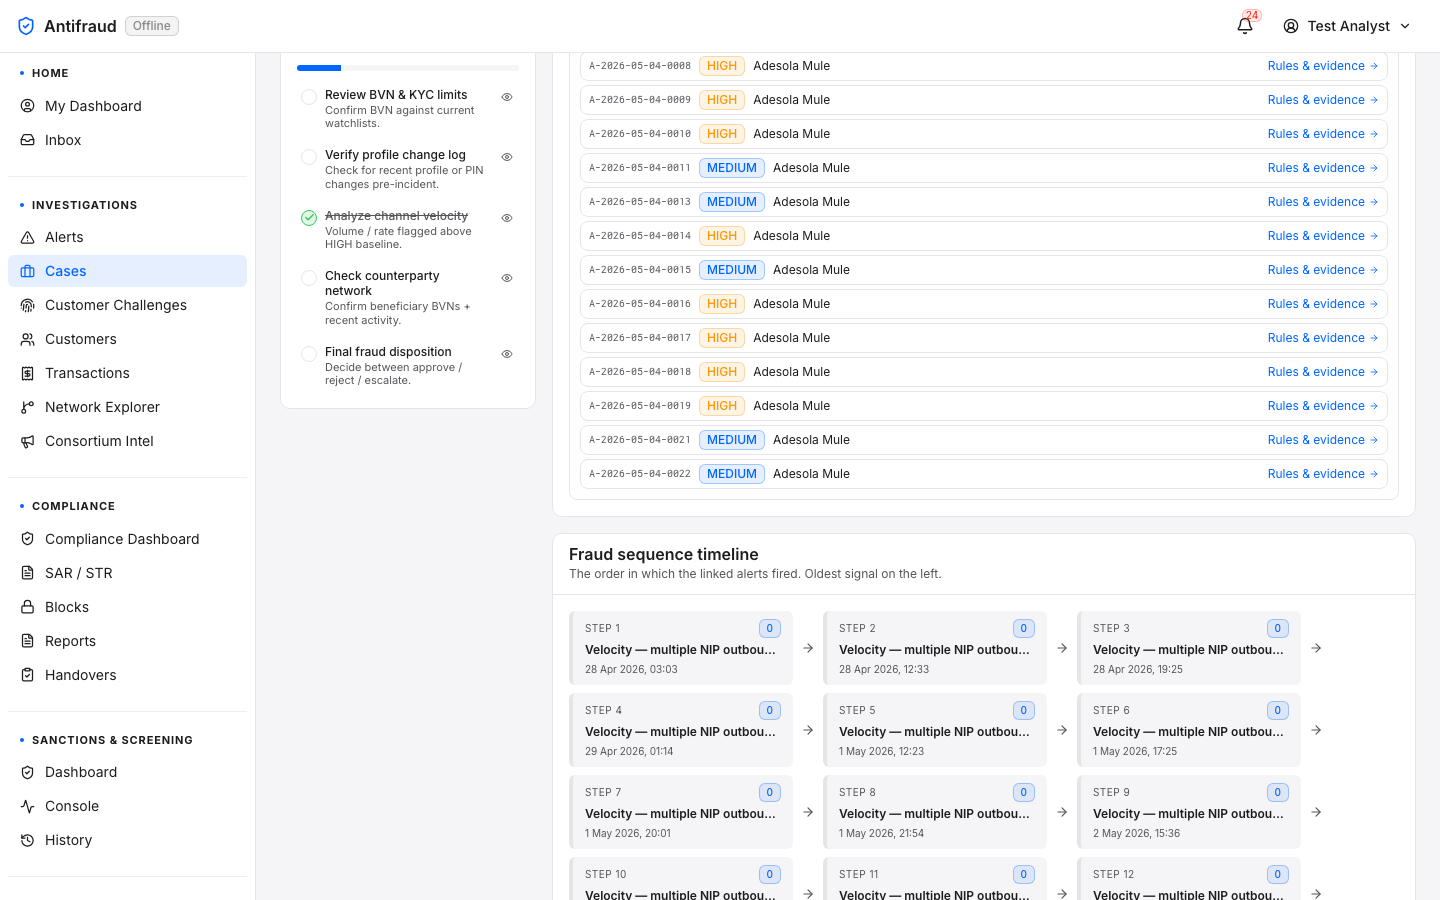
Case detail
Analysts/cases/<id>
The case workspace is where an investigation is built. It has tabs for the summary, the linked alerts, the transactions of interest, the customer profile, the evidence locker, and the activity timeline.
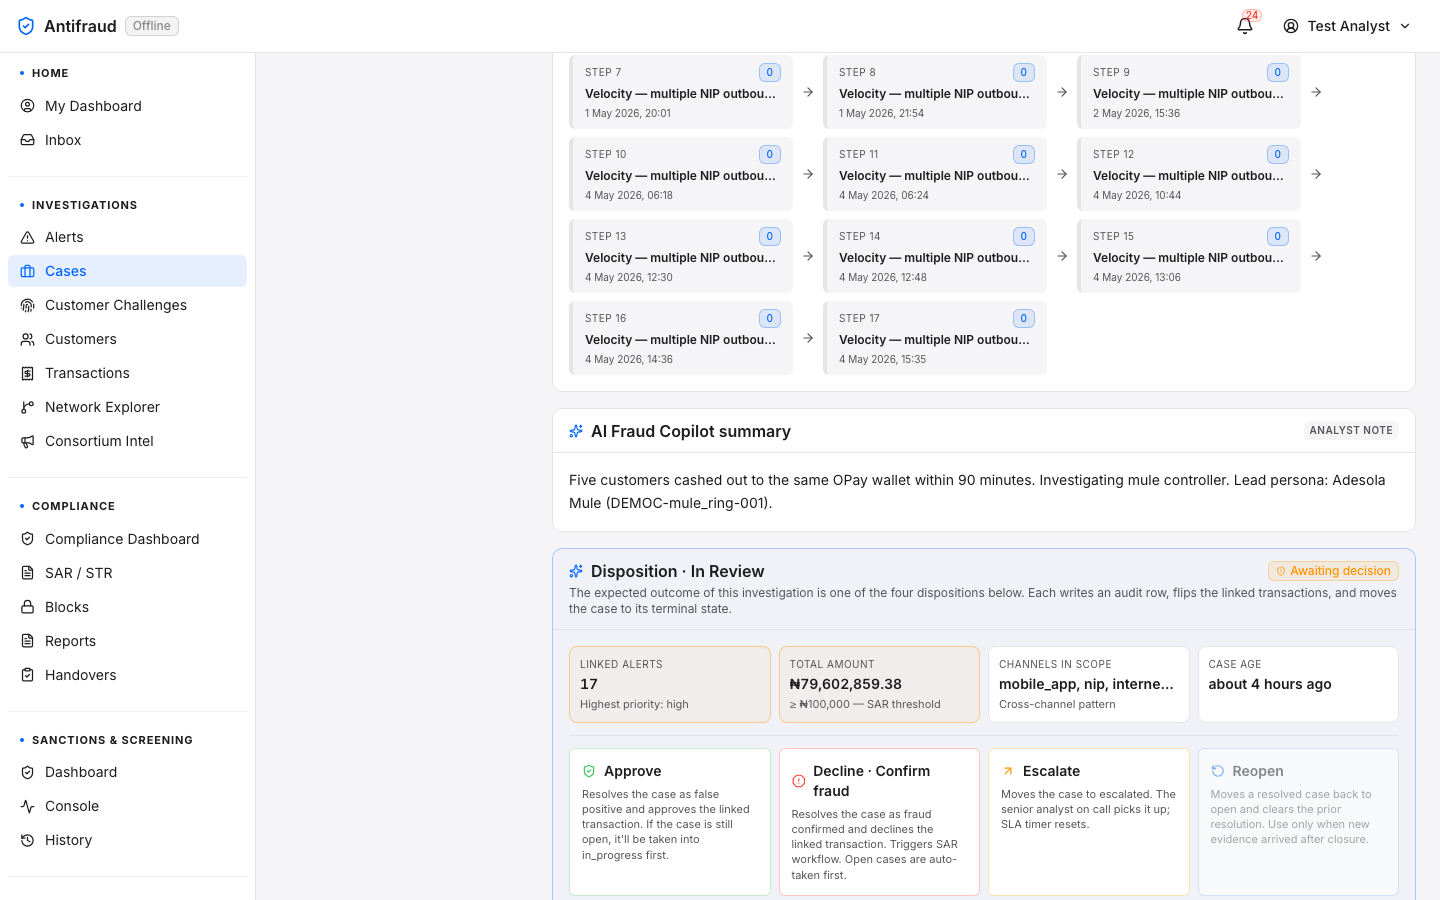
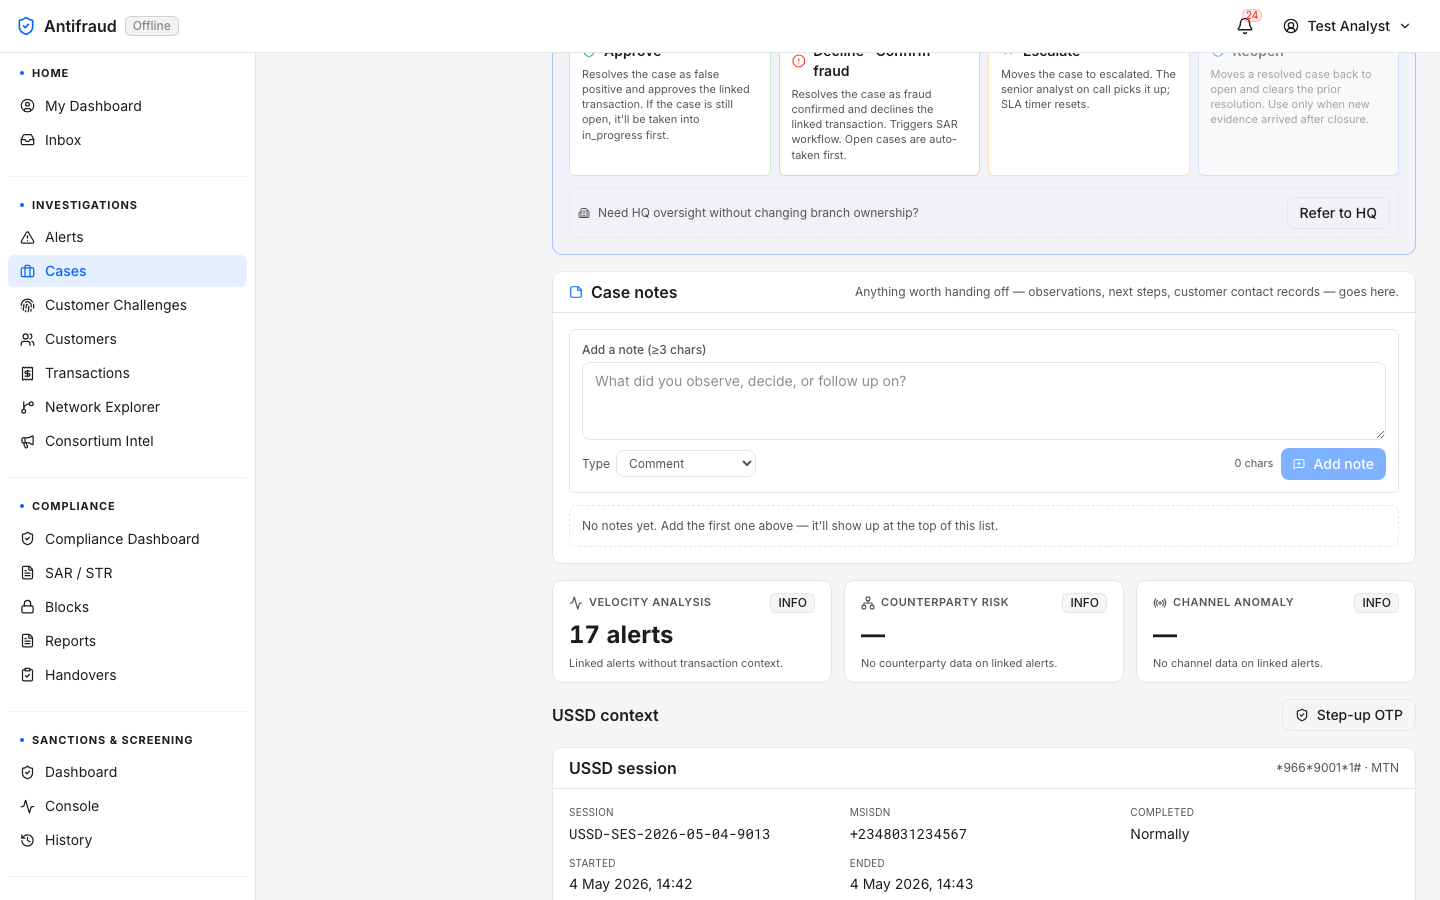
Figure 2.5a — Case detail (header). Subject, priority, state, age and SLA at a glance. Action bar on the right.Figure 2.5b — Case detail (evidence). Linked alerts and transactions; customer signal strip; rule rationale.Figure 2.5c — Case detail (timeline). Append-only timeline of every action by every analyst. The audit trail of the case.Figure 2.5d — Case detail (closure). Closure actions: close as confirmed fraud, close as not fraud, file SAR, hand over to the next shift.
Key actions
Link items. Drag alerts and transactions into the case to build the evidence pack.
Comment. Every comment is timestamped and signed; comments cannot be edited or deleted (only flagged).
File a SAR. Open the SAR wizard pre-populated with the case data — the regulator's narrative is the case timeline.
Place a block. Opens the block request form pre-filled with the case context.
Hand over. Park the case for the next shift with a structured note — see Handovers.
Close. Confirmed fraud, not fraud, or insufficient evidence. Closure is irreversible by analysts — reopening requires a team lead.
CautionA case cannot be closed while it has open alerts attached. Decide every linked alert first, or unlink alerts that turned out to be unrelated.
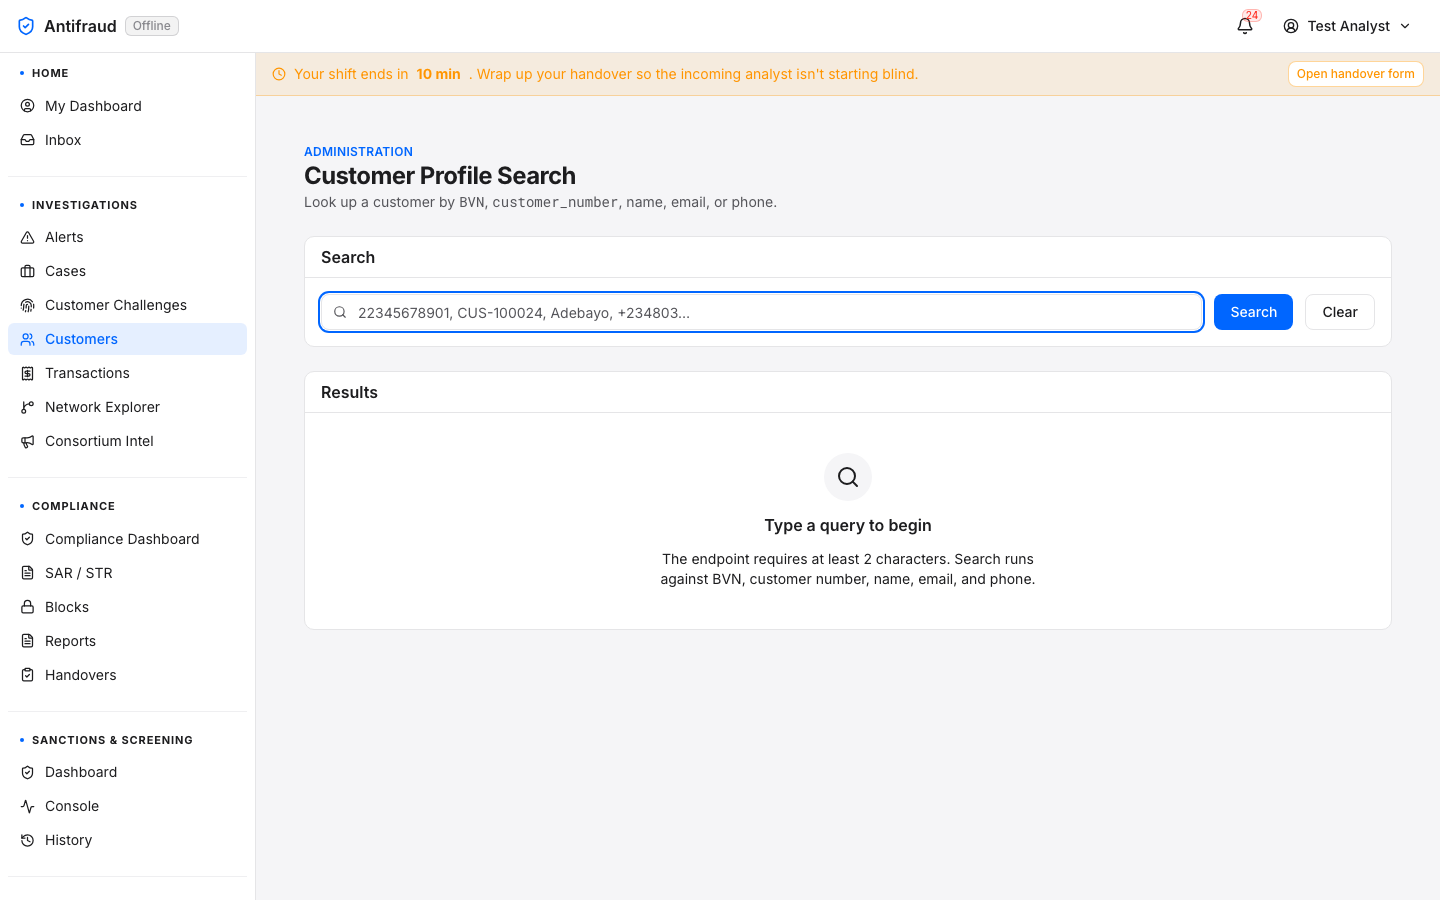
Customers search
Analysts/customers
A search-first hub for finding a customer by name, customer number, BVN, email or phone. The page intentionally renders no rows until the user has searched — the customer base is too large to list and a fishing expedition is not a valid use case.
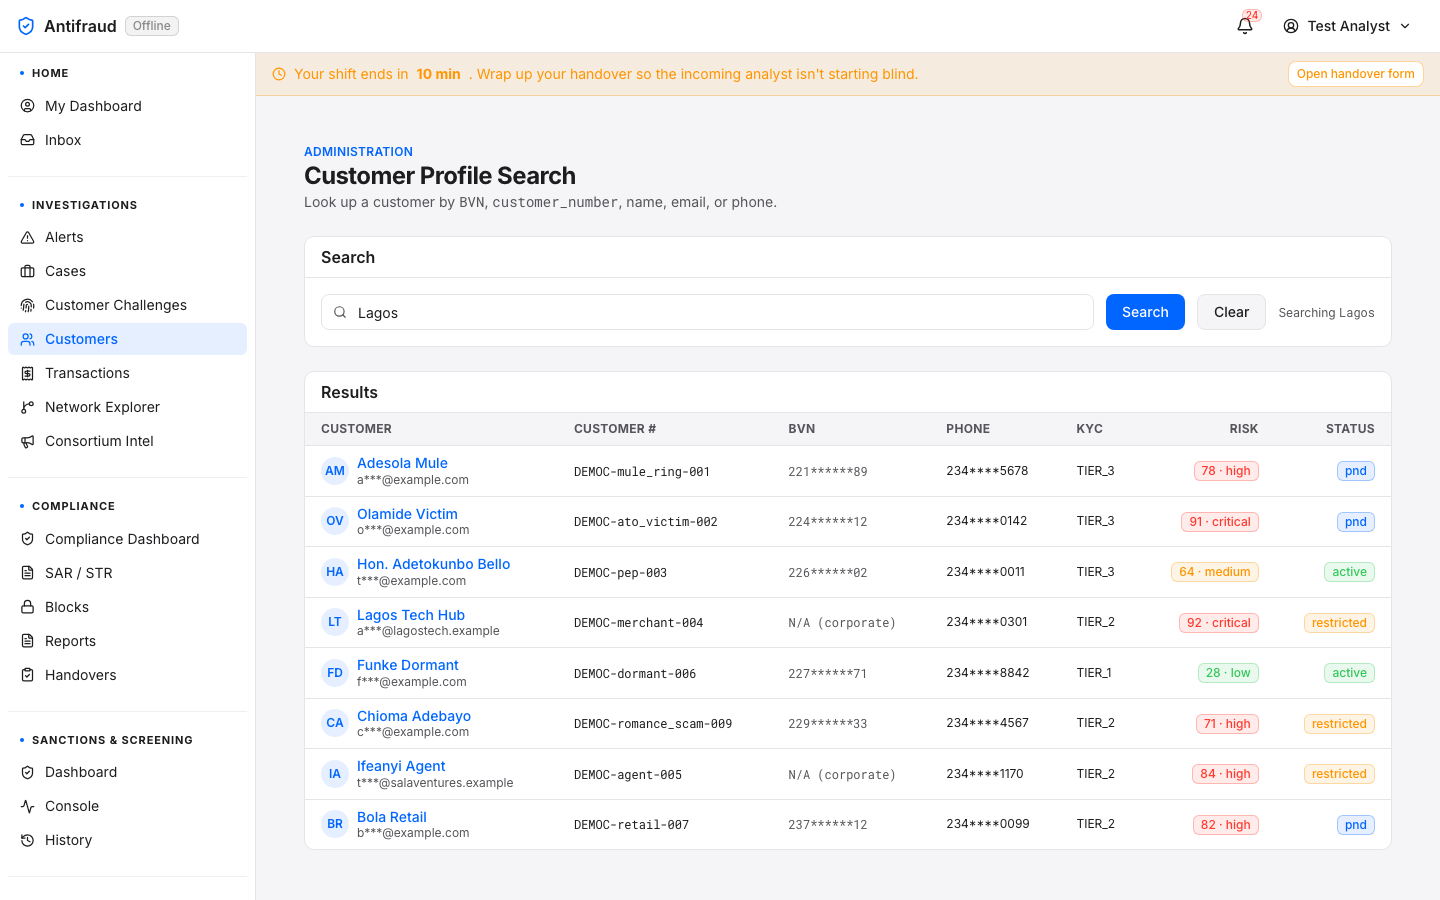
Figure 2.6a — Customers search (empty). Type a customer number, name, BVN, email or phone to find a record.Figure 2.6b — Customers search (results). The search bar carries the query Lagos; the Searching label confirms the query is committed. Eight matched customers render in the results table — Adesola Mule (high · 78 · pnd), Olamide Victim (critical · 91 · pnd), Hon. Adetokunbo Bello (medium · 64 · active), Lagos Tech Hub (critical · 92 · restricted), Funke Dormant (low · 28 · active), Chioma Adebayo (high · 71 · restricted), Ifeanyi Agent (high · 84 · restricted), Bola Retail (high · 82 · pnd). Each row shows the customer-number (DEMOC-<persona>-<seq>), the masked BVN, the masked phone, the KYC tier (TIER_1 / TIER_2 / TIER_3), the risk score + tier badge (colour-coded low → critical) and the account status badge (active / pnd / restricted). Hyperlinks on the customer name open Customer 360. Customers is the active tab in the Investigations module submenu, with Investigations highlighted in the left sidebar.
Result columns
Customer — display name and email; click to open Customer 360.
Customer number — institution identifier.
BVN — masked unless the analyst has elevated PII access.
KYC tier — Tier 1, 2, or 3.
Risk — composite score with risk-tier badge.
Status — Active, Restricted, PND, Closed.
NoteBVN and other PII fields are masked by default. Unmasked access is auditable and only available to analysts with customers:read_pii. Every unmask is recorded with the analyst's identity in the Audit log.
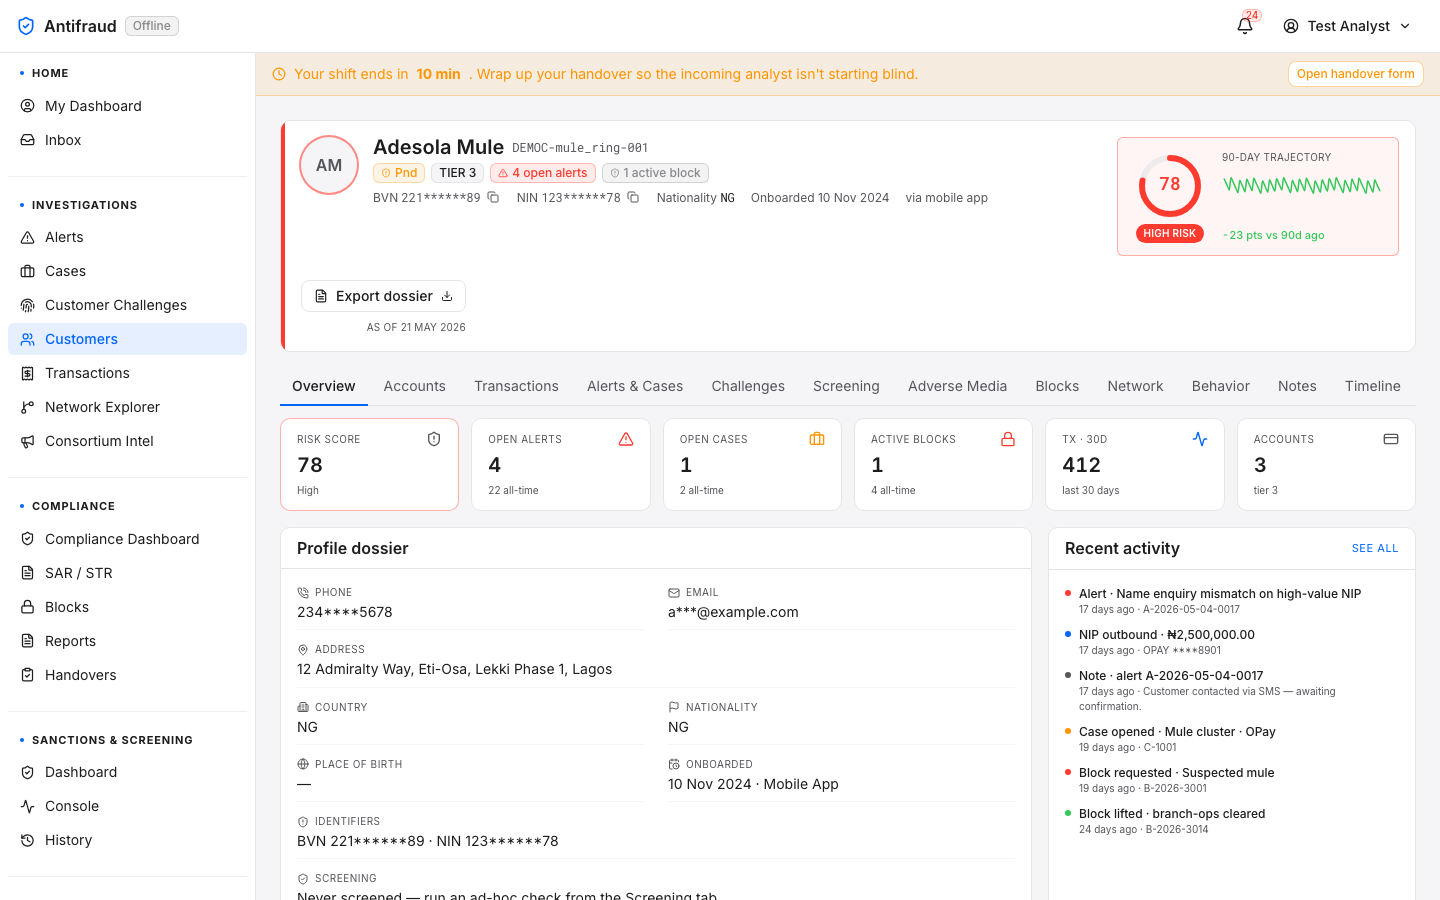
Customer 360
Analysts/customers/<id>
The single most-loaded page in the platform during an active investigation. Every fact the platform knows about the customer — identity, KYC, accounts, transactions, alerts, cases, challenges, screening hits, adverse-media verdicts, blocks, network neighbours and behaviour over time — is gathered here under one set of tabs.
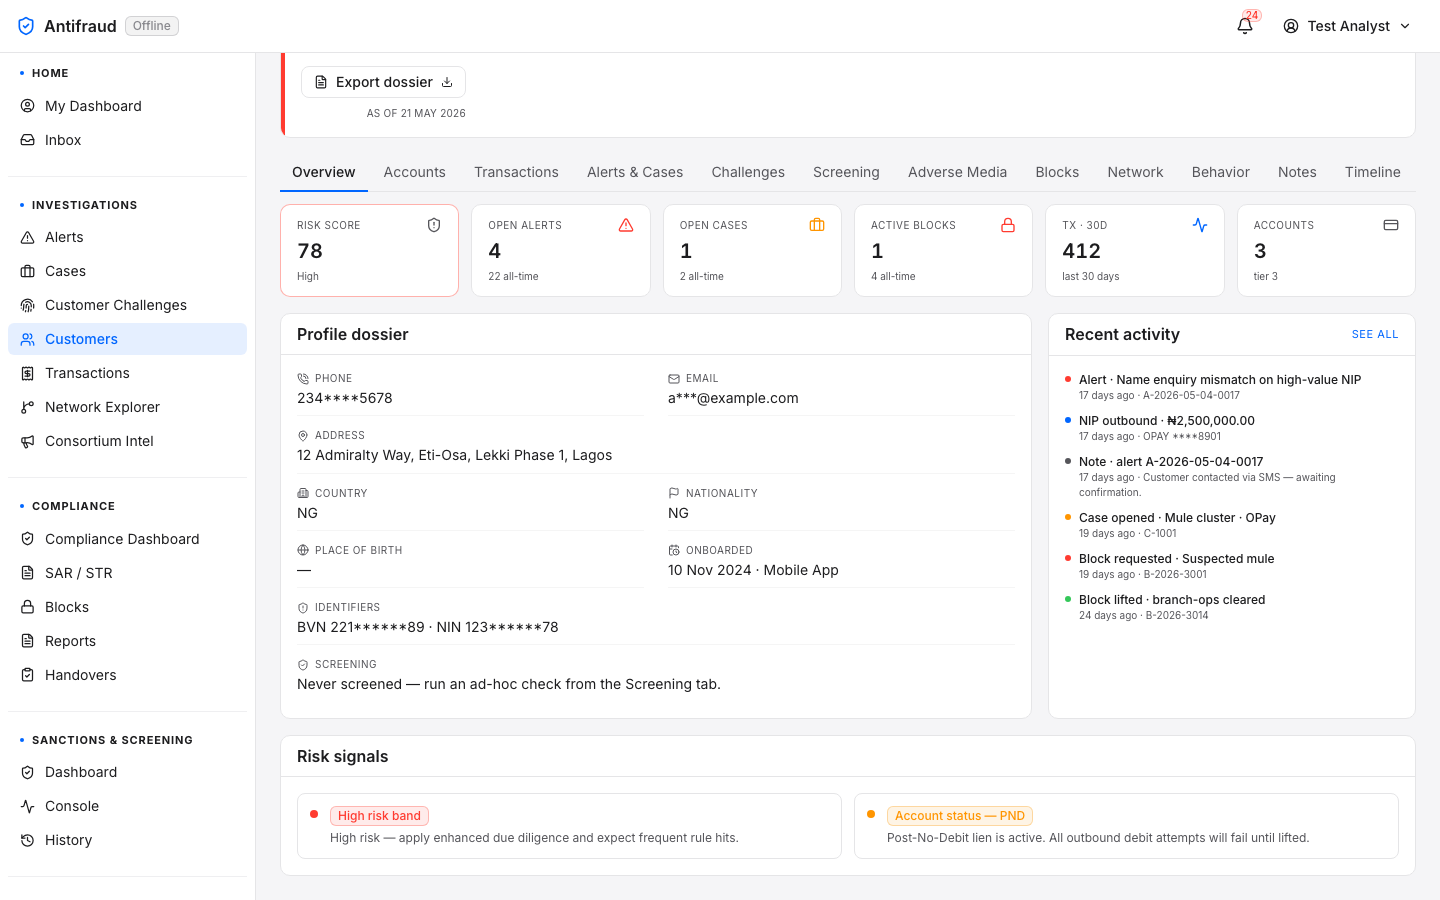
Figure 2.7a — Customer 360 (top). Header strip (identity + risk + 90-day trajectory), tabbed workspace, headline counters. The active tab is Overview.Figure 2.7b — Customer 360 (bottom). Recent activity feed and the profile dossier (KYC, address, identifiers, screening posture).
Every account owned by the customer with balances and statuses.
Transactions
Transaction history with channel filters and amount banding.
Alerts & Cases
Every alert and case ever raised against this customer.
Challenges
OTP, callback and video challenge outcomes.
Screening
Sanctions, PEP, watchlist and ad-hoc screening hits.
Adverse media
LLM-classified mentions, with verdict and citation trail.
Blocks
Active and historical blocks against any account.
Network
Counterparties, devices and connections — drill into Network Explorer.
Behaviour
Channel mix, time-of-day, amount distributions.
Notes
Analyst notes, append-only.
Timeline
Unified timeline of everything that has ever happened on the account.
Common actions
Export dossier. Top-right button. Produces a regulator-ready PDF of the entire 360 view.
Ad-hoc screen. Run the customer against sanctions / PEP / adverse-media on demand.
Trigger challenge. Step the customer up with OTP, callback or video proof of life.
Request a block. Pre-populates the block form with this customer and the case context.
Transactions
Analysts/transactions
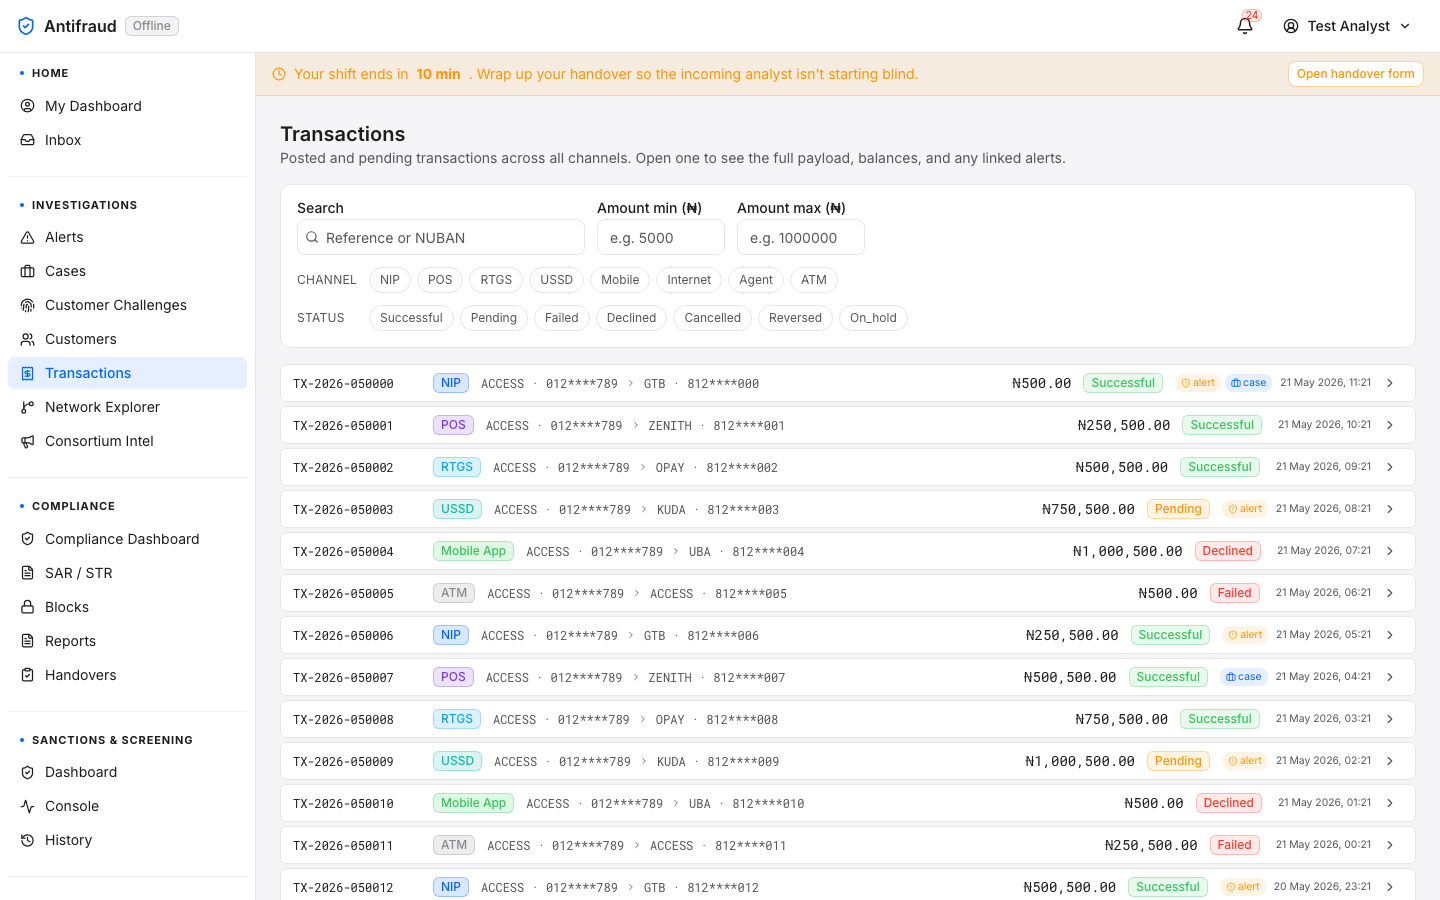
The cross-customer transaction explorer. Used when the question is "show me every transaction matching X" rather than "show me what this customer did". Filters span channel, amount, time, currency, counterparty and decision outcome.
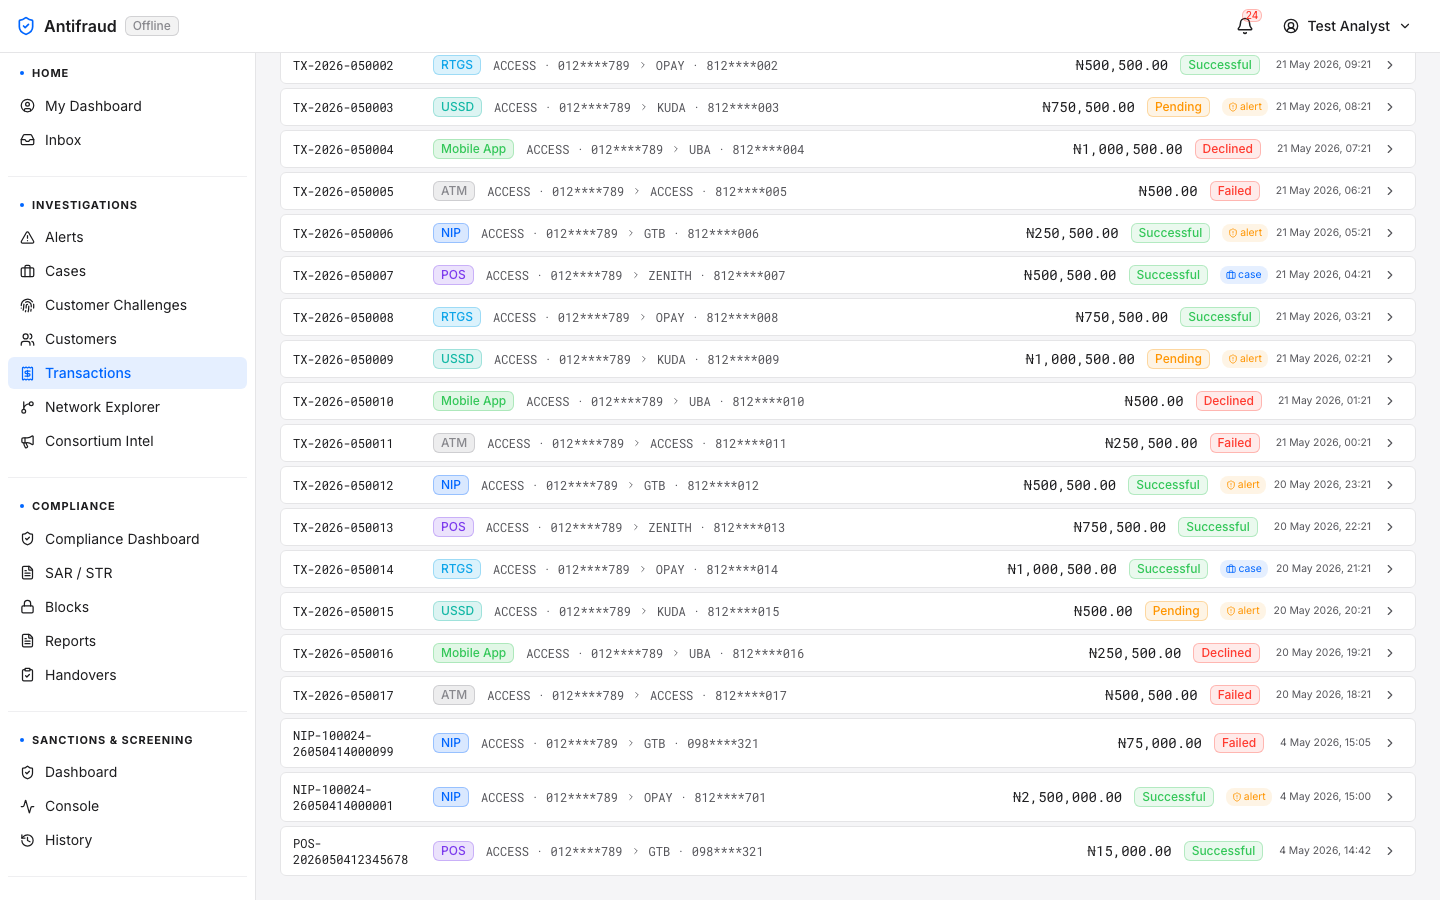
Figure 2.8a — Transactions (top). Filter strip across the top, results table below.Figure 2.8b — Transactions (lower controls). Pagination, page-size selector and export options.
Filters
Filters are persistent for the session — switching pages does not lose them. Channels (POS, NIP, RTGS, USSD, mobile, internet, agent, ATM) colour-code the results so a scan reveals channel concentration at a glance.
Transaction detail
AnalystsCompliance reviewers/transactions/<id>
Purpose
Single, printable, regulator-ready view of one transaction across every dimension that matters during an investigation.
Audience
Anyone with transactions:read — analysts during triage, compliance during SAR drafting, audit during a regulator visit.
When to use
Whenever a single transaction is the unit of work — confirming an alert rationale, attaching to a case, exporting as evidence.
The Transaction detail page is reached three ways: by clicking a row in the Transactions list, by following the underlying-transaction link from an alert, or by pasting a transaction reference into the global search bar. The same page is rendered for every channel — POS, NIP, RTGS, USSD, mobile, internet, agent, ATM — and adapts its content to whichever signals the channel produces, instead of duplicating the layout per channel.
Layout
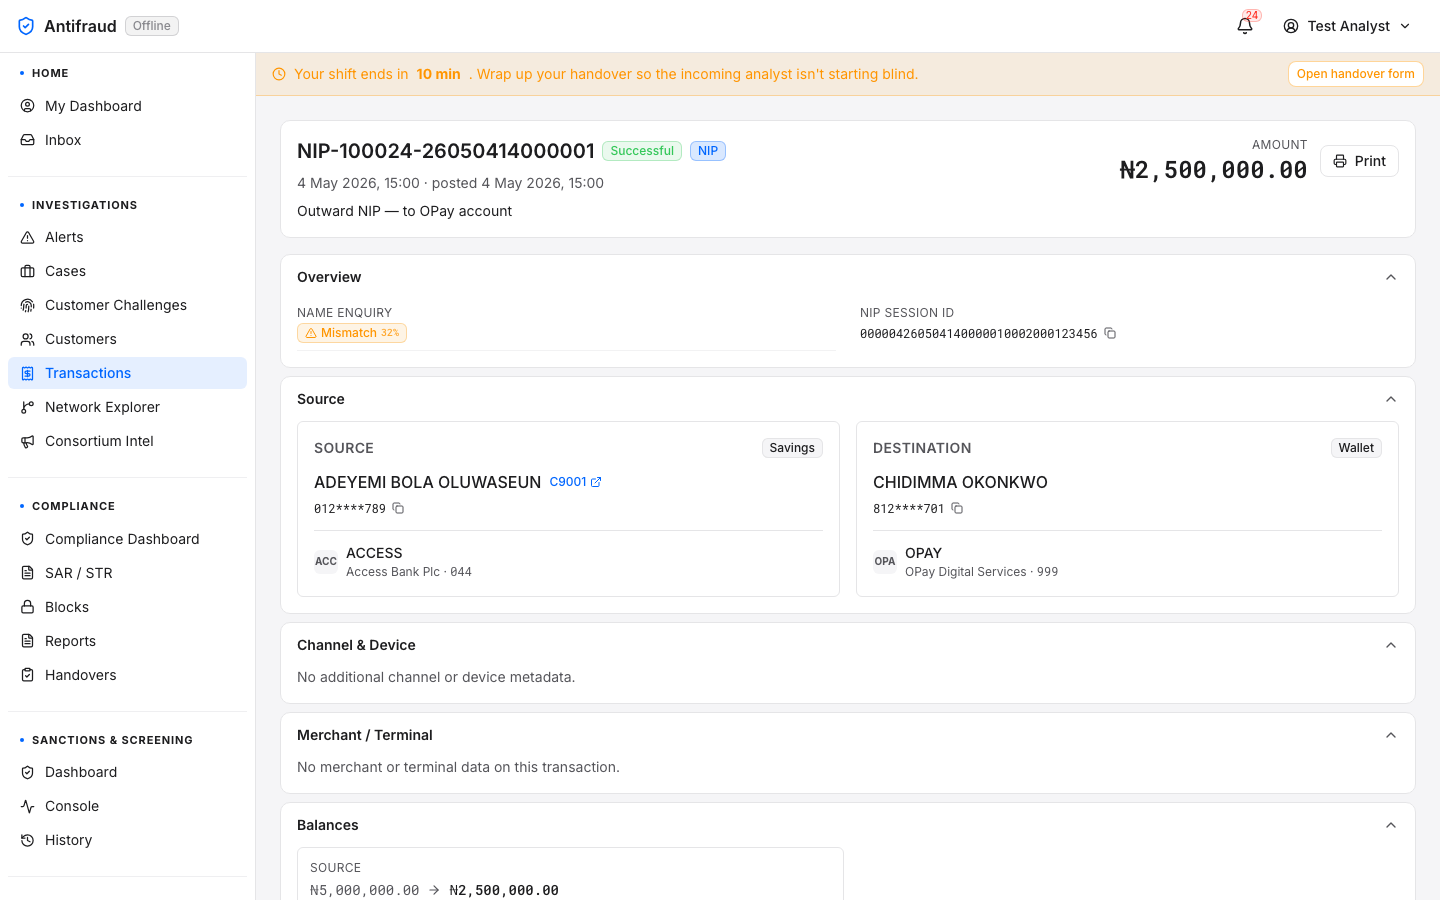
The page is a sticky-header workspace above a Radix-style accordion. Every accordion section is open by default so the analyst sees the whole transaction in one scroll; sections can be collapsed individually to skim, and the print stylesheet forces all sections open regardless of state so the printable evidence pack is always complete.
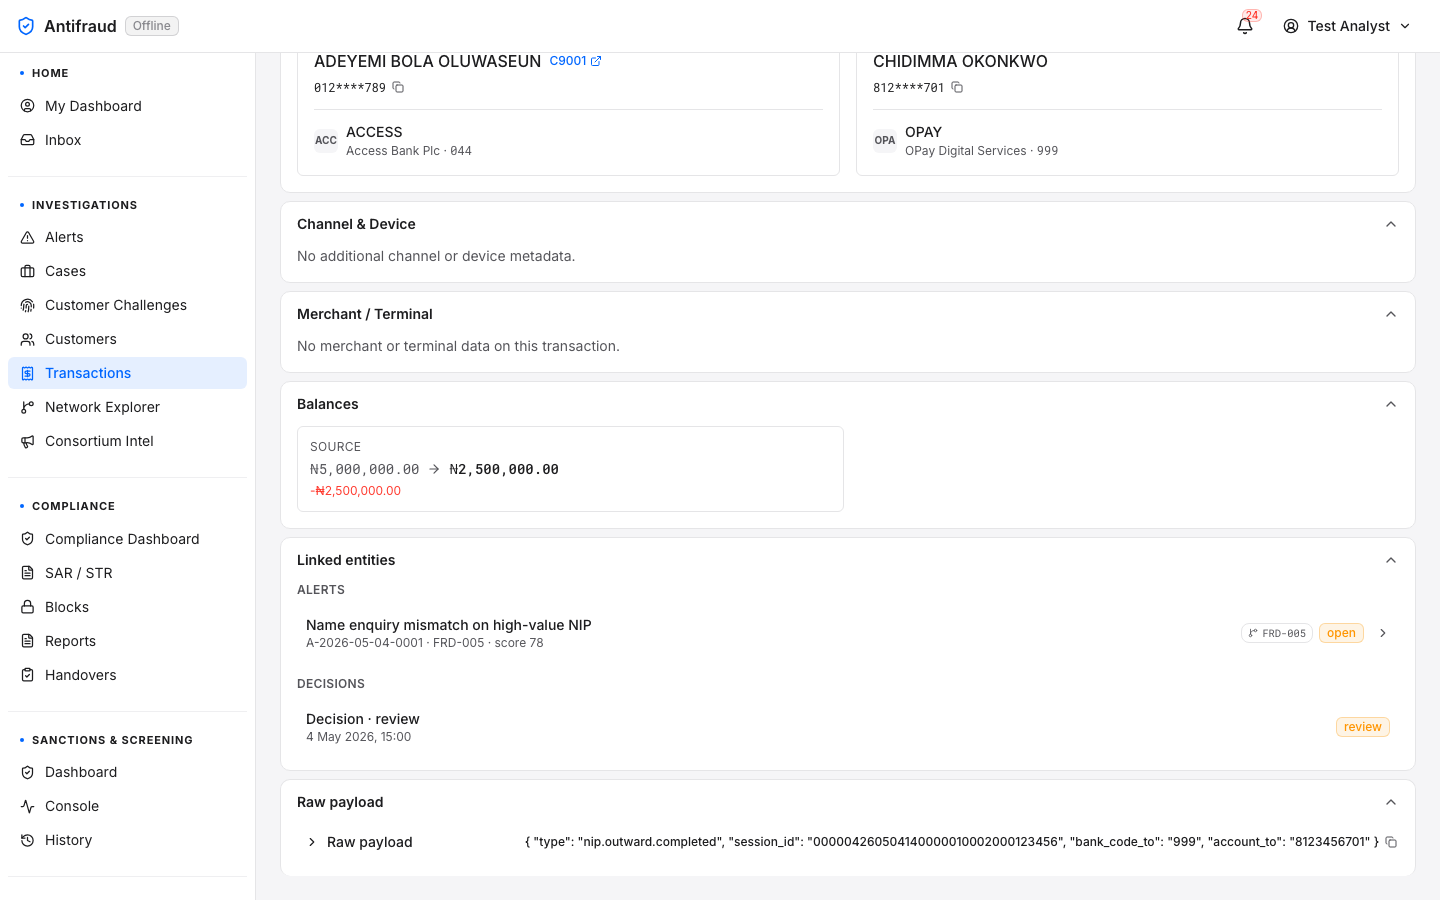
Figure 2.9a — Transaction detail (top). Sticky header with the transaction reference NIP-100024-26050414000001, the Successful + NIP status/channel chips, the amount (₦2,500,000.00) and the Print action. Overview section shows the Name Enquiry mismatch (32% similarity) and the NIP session id. Source & Destination cards render side-by-side with masked accounts, bank codes and a cross-link to the originating customer (C9001). Channel & Device and Merchant / Terminal sections render an explanatory dash because NIP does not produce those signals. Transactions is the active tab in the Investigations module submenu, with Investigations highlighted in the left sidebar.Figure 2.9b — Transaction detail (bottom). Lower half of the page after scrolling: Source/Destination tile bases; Channel & Device and Merchant / Terminal "no signal" panels; Balances (source debit ₦5,000,000 → ₦2,500,000 with the −₦2,500,000 reduction in red); Linked entities listing the FRD-005 name-mismatch alert at score 78 with an open badge, plus the attached Decision · review; and the Raw payload section with its one-line JSON preview and copy-on-click affordance.
Header — the at-a-glance row
The header strip is sticky on long-scroll so the transaction reference, status and amount remain visible while the analyst reads through the rest of the page.
Field
Meaning
Transaction reference
The institution-issued identifier (POS-, NIP-, RTGS-, USSD-…). The single most useful piece of evidence to put in a case note. Copy-on-click.
Status chip
Successful · Pending · Failed / Reversed · Cancelled. The terminal state of the transaction in the source system.
Channel badge
POS · NIP · RTGS · USSD · mobile · internet · agent · ATM. Colour-coded the same way as the Transactions list so the eye carries colour memory between the two pages.
Amount
Right-aligned and bold. Currency is the institution's default unless the transaction is explicitly multi-currency.
Occurred at / Posted at
Initiation time and settlement time. Useful for spotting NIP-style settle lag.
Print
Opens the browser print dialog with the print stylesheet applied. Every accordion section is forced open in the PDF so nothing is hidden in the printed evidence pack.
The seven accordion sections
Section
What it shows
Important when…
1. Overview
Channel-specific high-signal fields: name-enquiry result, NIP session ID, RTGS payment instruction, POS auth code. These are the fields most likely to be quoted in a SAR narrative.
Reviewing the alert rationale; quick scan to decide whether to escalate.
2. Source
The debiting party: customer name (if a known customer), NUBAN, account type (Savings, Current, Wallet), holding bank with CBN code. The customer link opens Customer 360.
Confirming the originating account belongs to the customer on the alert.
3. Destination
The crediting party. Often a different institution; OPay, Kuda and PalmPay receiving accounts are common destinations for mule transfers and the platform colour-codes high-velocity counterparties.
Spotting "first-stop" beneficiaries that the consortium has already seen.
4. Channel & Device
For online channels — device fingerprint, OS, browser, IP, geo-IP, ASN, Tor flag, SIM-swap signal, recent-device-change marker.
The source debit and destination credit shown as an arrow with explicit pre- and post-balance values; reversals show the inverse.
Confirming the transaction actually moved value (vs declined / reversed).
7. Linked entities
Every alert that fired on this transaction, every decision attached, every case it belongs to.
Building the evidence pack. Each row links back to the alert / case it represents.
8. Raw payload
The verbatim canonical JSON that landed on the platform from the source system. Collapsible; click to expand. Copy-on-click to attach to a SAR draft.
Disputes — when the regulator asks "show me exactly what the platform was given".
NoteChannel & Device and Merchant / Terminal render an explanatory dash ("No additional channel or device metadata.") when the channel does not produce that signal. The dash is intentional — it tells the analyst the absence is normal for this channel, not that data is missing.
How to use
Read the Overview first. For a NIP transfer, check the Name Enquiry result; for POS, check the auth code and the entry mode; for RTGS, read the narration.
Confirm the Source belongs to the customer on the alert. A mismatch here is itself a finding.
Look at the Destination. Click the destination customer link if it is internal; check the counterparty bank if it is external.
Open Linked entities to see which alerts fired on this transaction and the analyst decisions already recorded.
Decide. From this page you can pivot to the alert, the case, the source customer or the destination customer; you can attach the transaction to a case; or you can print the evidence pack.
Actions
Action
Behaviour
Permission
Print
Renders the page with every section forced open and the chrome stripped. Save as PDF to attach to a SAR or a case note.
transactions:read
Open customer
Pivots to the source or destination customer's Customer 360.
customers:read
Open alert
From a row in Linked entities — opens the alert detail page.
alerts:read
Attach to case
Adds the transaction to an existing case as evidence. Reachable from the case workspace, not from this page directly.
cases:edit
Copy raw payload
Copies the verbatim canonical JSON to the clipboard. Useful for SAR drafts and audit replies.
transactions:read
Permissions & PII
The page requires transactions:read. NUBAN and BVN fields are masked by default; analysts with customers:read_pii see the unmasked value and every unmask is recorded in the Audit log. Raw-payload PII follows the same rule — sensitive fields inside the JSON are masked in the rendered preview but the unmasked value is available in the copied clipboard text only when the elevated permission is held.
Operational notes
One canonical record per transaction. A reversal does not produce a second transaction — the platform reuses the same record and updates the status. The Balances section flips to show the reversed direction.
NIP session ID is the high-signal join key. When an analyst pivots between this page, the Network Explorer and the consortium feed, NIP session ID is the field most likely to match.
Print is the regulator-ready export path. The PDF produced by the browser print dialog is the format the platform commits to for evidence packs. Custom downloads or screenshot exports are not equivalent.
Linked entities is the back-pointer. If an alert was raised on a transaction but the analyst opened the transaction first, this is where they find the alert. There is no "no alerts" empty state — the section is hidden entirely when there are none.
CautionIf the transaction reference shown in the header does not match the reference you typed into the address bar, you are looking at a different transaction — the platform never silently rewrites references. Investigate the link that brought you here; a mismatch is a signal of corrupted state or a broken integration.
Common pitfalls
Quoting the database id in a SAR instead of the transaction_reference. The reference is institution-issued and customer-recognisable; the database id is not.
Copying the masked NUBAN out of the rendered text. Use the copy widget — it copies the unmasked value (subject to PII permission) so downstream attachments are usable.
Closing the Raw payload accordion before printing. The print stylesheet re-opens it automatically, but on-screen review may miss it if collapsed.
Treating "No additional channel or device metadata" as a bug. For NIP, RTGS and most server-to-server channels this is the normal state.
TipThe header layout is responsive — on narrow screens the chips wrap and the page never horizontally scrolls. If you are demoing on a small projector, the page will still read cleanly.
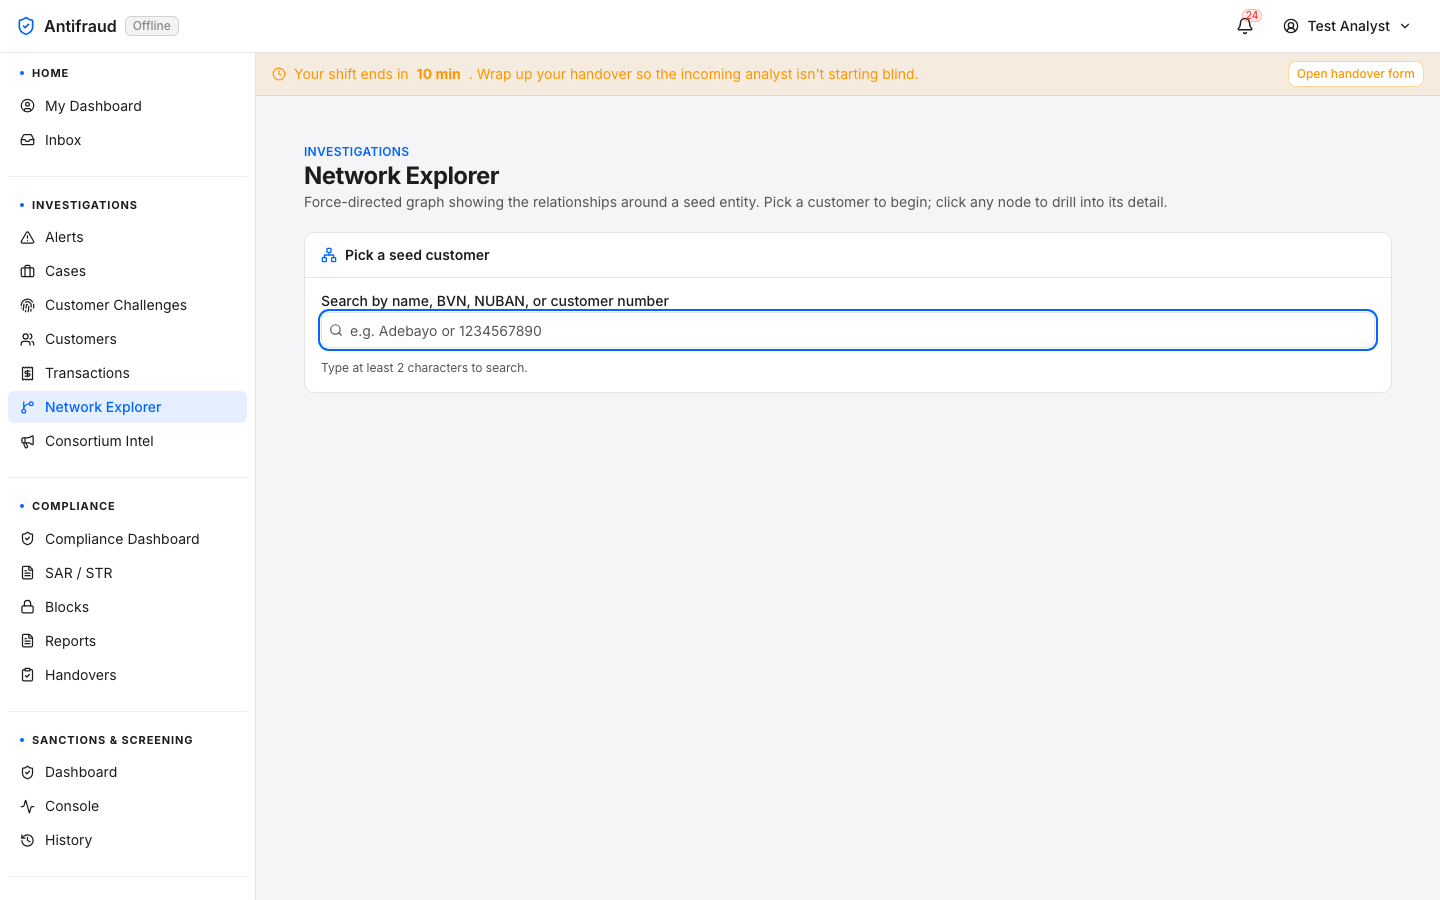
Network Explorer
Analysts/investigations/network
A force-directed graph that lays out the customer, the counterparties they have transacted with, the devices used and the accounts touched. The right tool when the investigation is about a ring rather than a single customer.
Figure 2.10 — Network Explorer. Seed a search with a customer or account; expand neighbours; highlight the cluster.
How to use
Seed the graph by typing a customer number, account, BVN, device hash or phone number.
Click a node to expand its first-degree neighbours. Repeat to broaden the picture.
Use the legend toggles to hide weak edges or filter to a single channel.
Copy a node's identifier into the clipboard with the small inline button beside it — useful when pivoting back to Customer 360.
TipMule rings are usually obvious in Network Explorer within two hops — look for a star pattern where many customers transact with the same wallet over a short window.
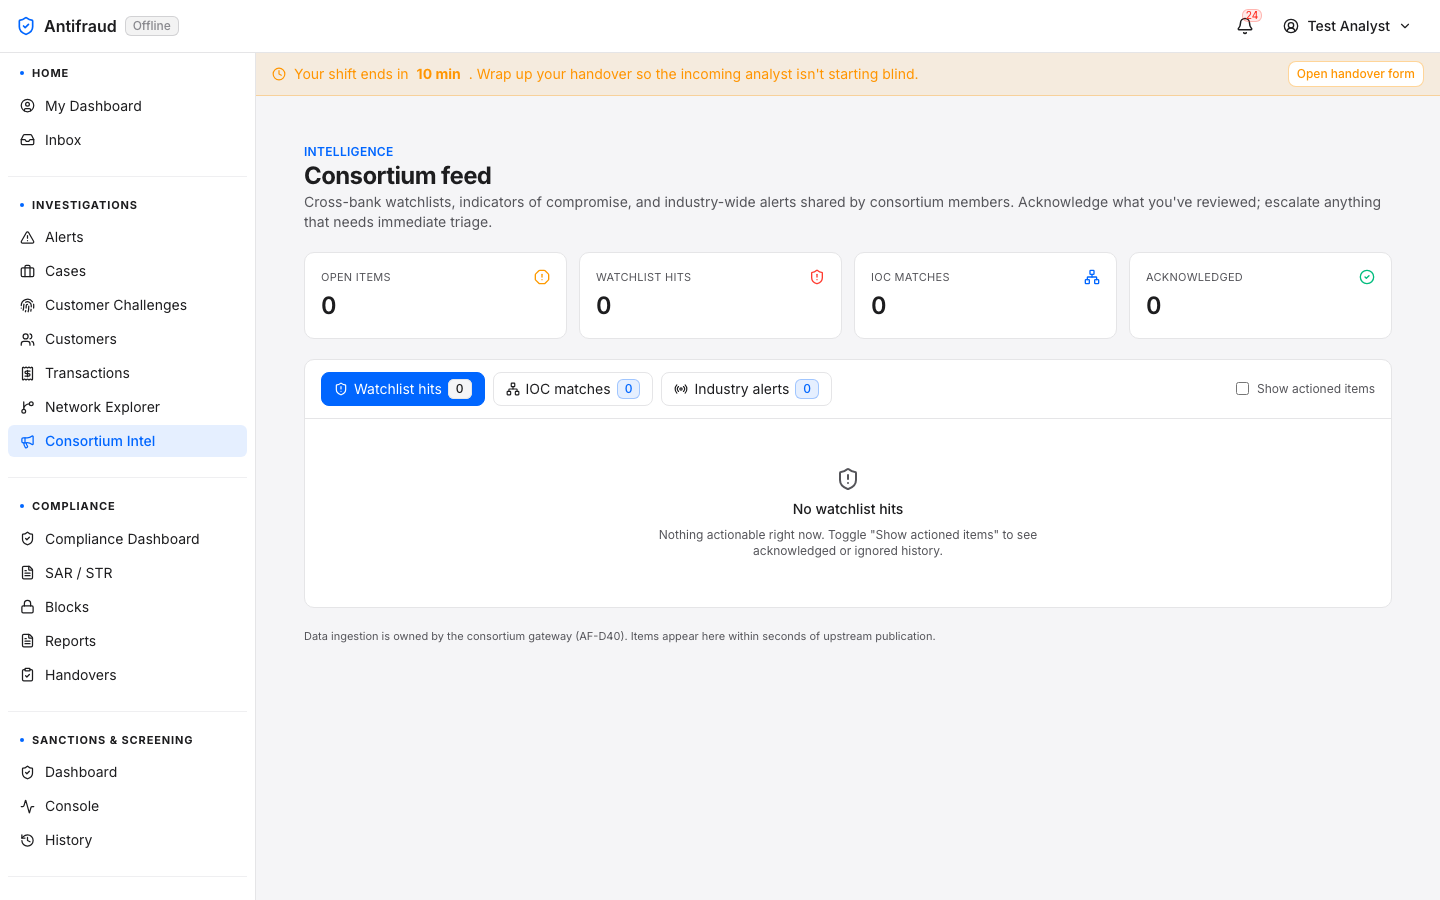
Consortium Intelligence
Senior analysts/intelligence/consortium
The shared intelligence feed — typologies, suspicious counterparty wallets, compromised device hashes and emerging tactics — contributed by every Kupinga tenant in anonymised form. Used to spot fraud that another bank already saw, before it spreads.
Figure 2.11 — Consortium Intelligence (admin view). INTELLIGENCE eyebrow above the Consortium feed title with the operator brief: "Cross-bank watchlists, indicators of compromise, and industry-wide alerts shared by consortium members. Acknowledge what you've reviewed; escalate anything that needs immediate triage." Four KPI tiles across the top — Open items, Watchlist hits, IOC matches, Acknowledged — all at 0 in this fresh sandbox tenant. Three tabs follow (Watchlist hits selected, IOC matches, Industry alerts) with the empty-state copy "No watchlist hits — Nothing actionable right now. Toggle 'Show actioned items' to see acknowledged or ignored history." Footnote at the bottom: "Data ingestion is owned by the consortium gateway (AF-D40). Items appear here within seconds of upstream publication." Consortium Intel is the active tab in the Investigations module submenu, with Investigations highlighted in the left sidebar.
CautionContributions to the Consortium are stripped of PII before they leave the institution, but contributions are governed by the institution's data sharing policy. Make sure your role-tier permits contribution before publishing a signal.
Compliance
Regulatory workflows — SAR/STR filings, block management, regulatory reports, and the compliance officer's dashboard.
The Compliance section is the regulator-facing surface of the platform. It is where Suspicious Activity Reports are drafted, reviewed and filed; where blocks and post-no-debit orders are requested, approved and lifted; where reports are scheduled to land in the regulator's inbox; and where the compliance officer's day starts.
Compliance dashboard
Compliance officers/compliance
Purpose
One screen for the SAR/STR pipeline, the regulatory return schedule and the compliance calendar.
Audience
Compliance officers; anyone with audit:read.
When to use
First page of the compliance officer's day. Also useful before regulator visits.
Figure 3.1a — Compliance dashboard (top). SAR pipeline funnel, time-to-file metrics, regulator-facing KPIs.Figure 3.1b — Compliance dashboard (middle). Regulatory return schedule with status badges.Figure 3.1c — Compliance dashboard. Blocks and freezes overview, customer challenge outcomes.Figure 3.1d — Compliance dashboard (bottom). Compliance calendar — upcoming filings, audits and trainings.
What it tells you
How many SARs are in each pipeline stage — drafted, reviewed, approved, filed.
Whether any regulatory return is at risk of being filed late.
How blocks and challenges are landing this period.
Upcoming compliance events on the calendar.
SAR / STR filings
Compliance officers/sars
The SAR / STR workspace. Drafts are prepared from a case, reviewed by a second pair of eyes, approved by a third, and filed with the regulator. Each step is gated by a separate permission — the standard separation-of-duties pattern that auditors expect.
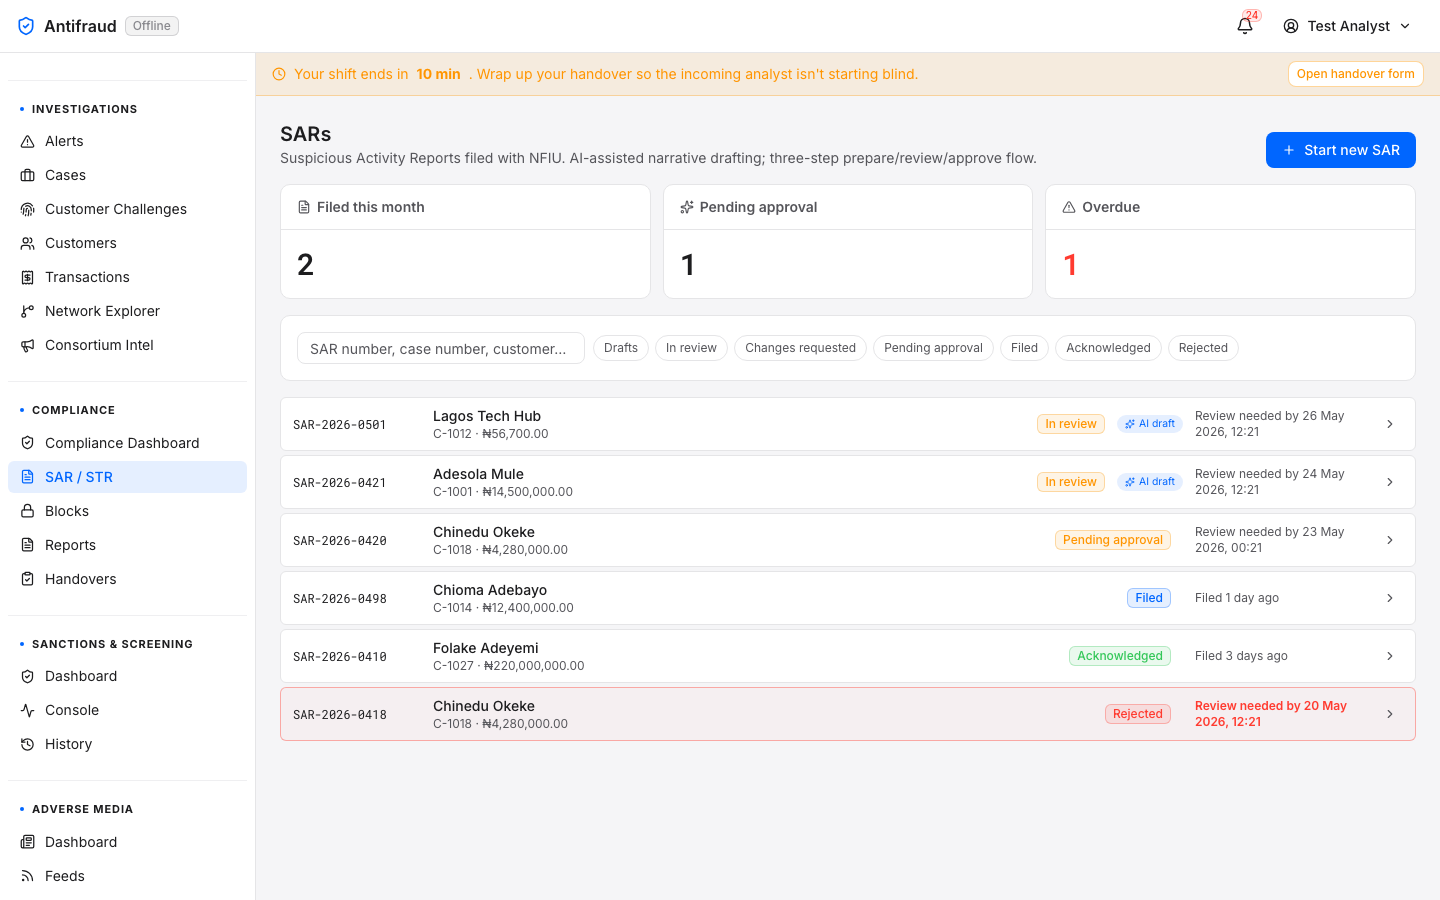
Figure 3.2 — SAR / STR list. Drafts, in review, approved, filed. Filter by stage, owner or originating case.
Lifecycle
Prepare (sars:prepare) — Open a case and click File SAR. The wizard pre-fills subject, narrative and attached evidence from the case.
Review (sars:review) — A reviewer (not the preparer) reads the draft and either returns it for amendment or moves it to approval.
Approve (sars:approve) — An approver (not the preparer, not the reviewer) gives the final sign-off.
File — The platform submits the SAR to the regulator's filing endpoint and stores the acknowledgement.
CriticalThe three permissions are deliberately separated. An institution that grants all three to the same user breaks separation of duties and may produce an audit finding. Use role tiers to enforce the separation.
Blocks & freezes
Analysts & team leads/blocks
Blocks are restrictive actions placed on a customer's account — Post-No-Debit, transaction freeze, partial restriction or full freeze. Every block goes through a maker-checker flow so no single user can freeze an account on their own (with the exception of explicit emergency-block permissions held by a small group of leads).
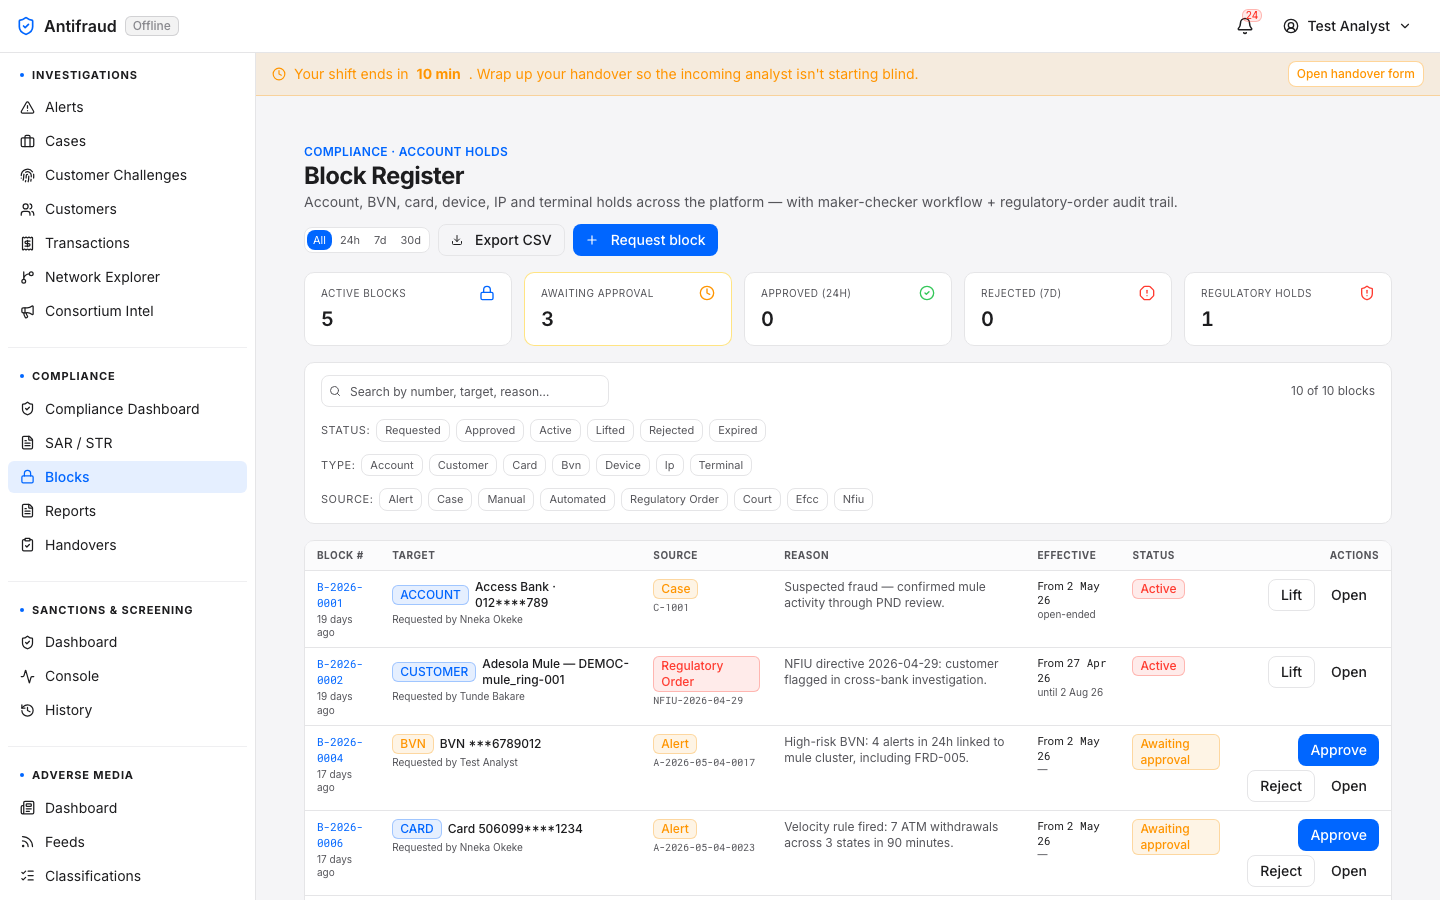
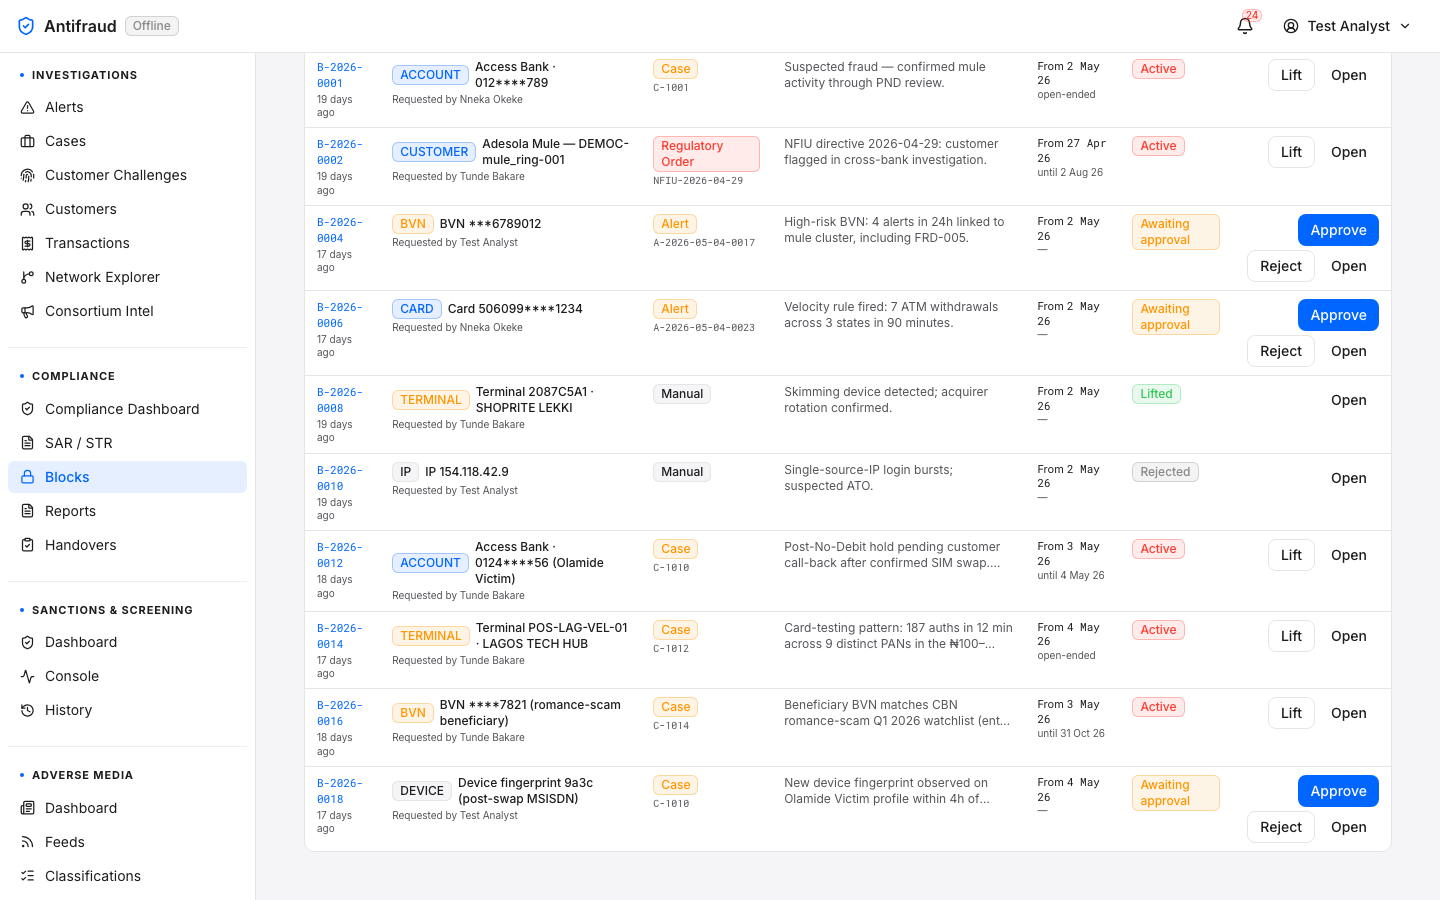
Figure 3.3a — Active blocks (top). Active and expiring blocks, with the account, the rationale, and the requester.Figure 3.3b — Active blocks (lower). History strip and bulk-action affordances.
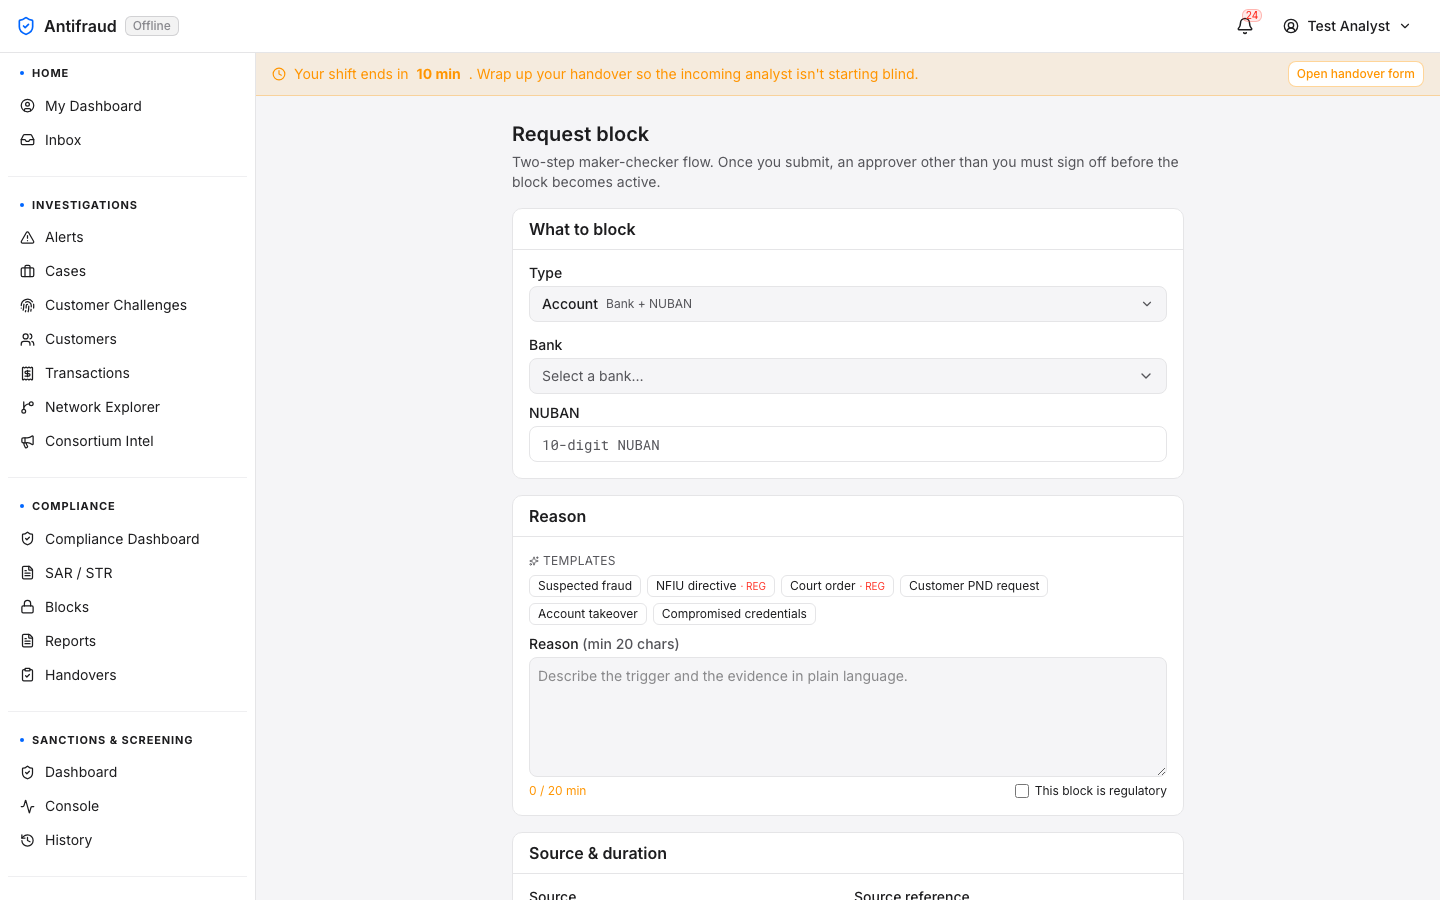
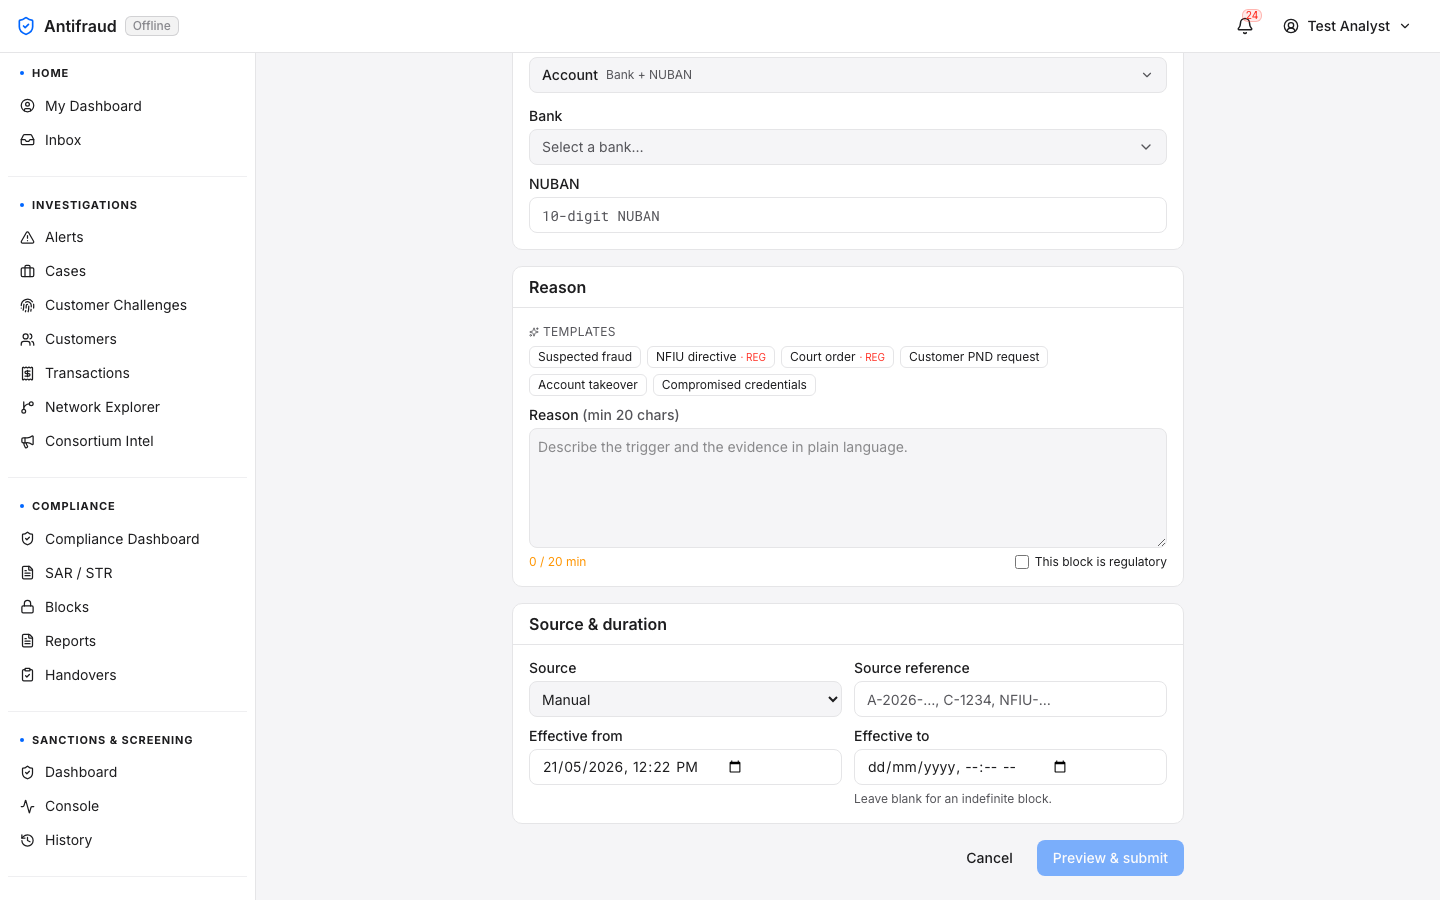
Requesting a block
Figure 3.4a — Block request form (top). Pre-fills customer / account when launched from an alert or case.Figure 3.4b — Block request form (bottom). Block type, duration, rationale and supporting attachments.
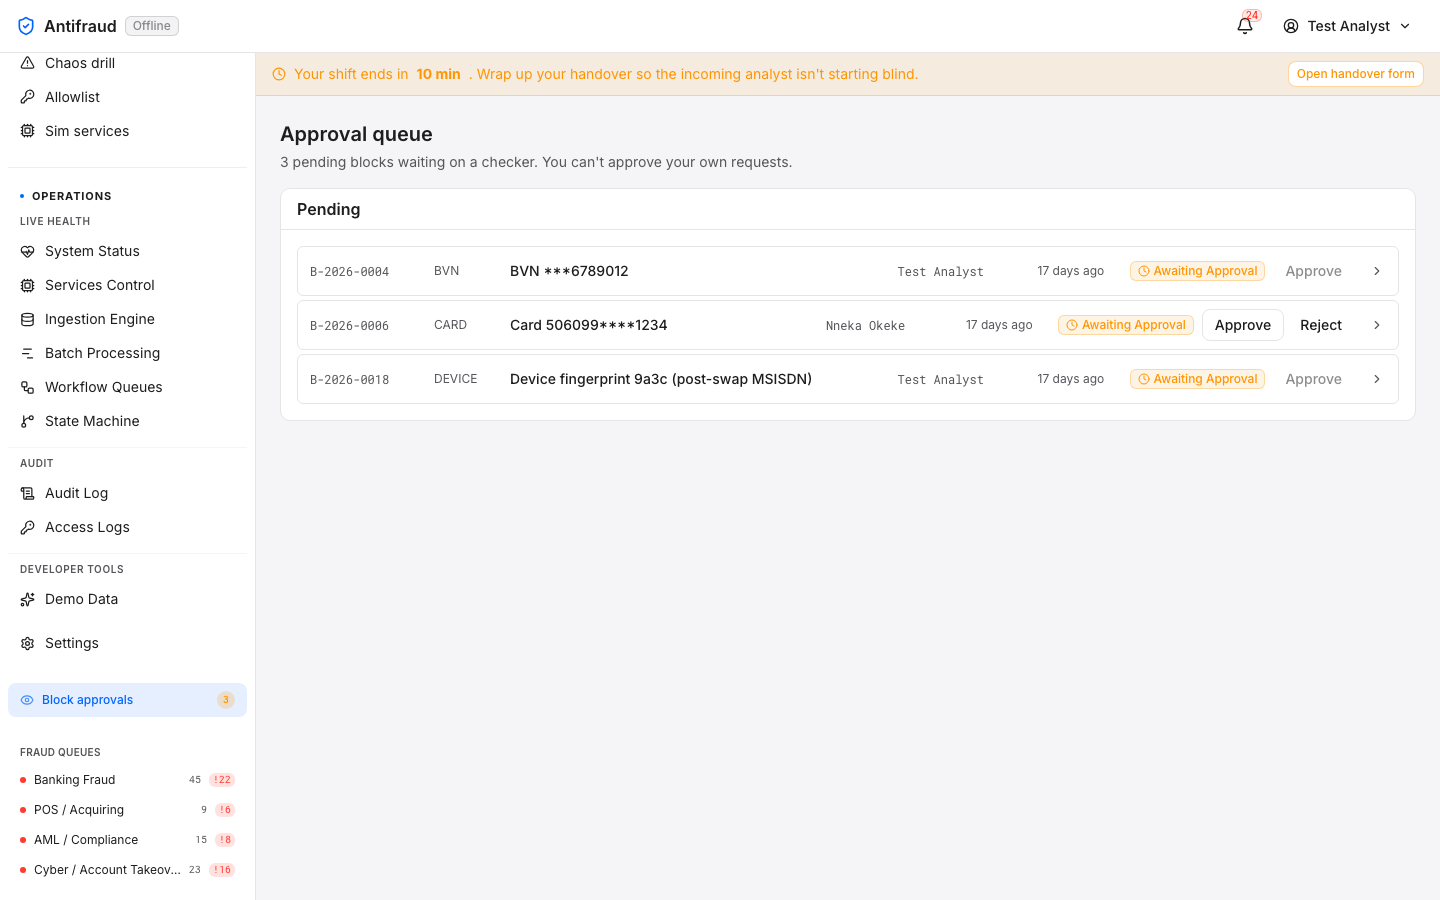
Approval queue
Figure 3.5 — Block approval queue. Pending blocks awaiting a second approver. The requester cannot approve their own request.
Permissions
Action
Permission
Notes
Request a block
blocks:request
Granted to analysts and above.
Approve a block
blocks:approve
Approver must be different from the requester.
Lift a block
blocks:lift
Standard lifts. Regulatory blocks need blocks:lift_regulatory.
Emergency block (no checker)
blocks:emergency
Held by a very small group. Every emergency block produces an audit ticket.
CautionA block that has been on a customer for more than seven days without a status update produces an SLA breach. Schedule a review meeting before the seven-day point.
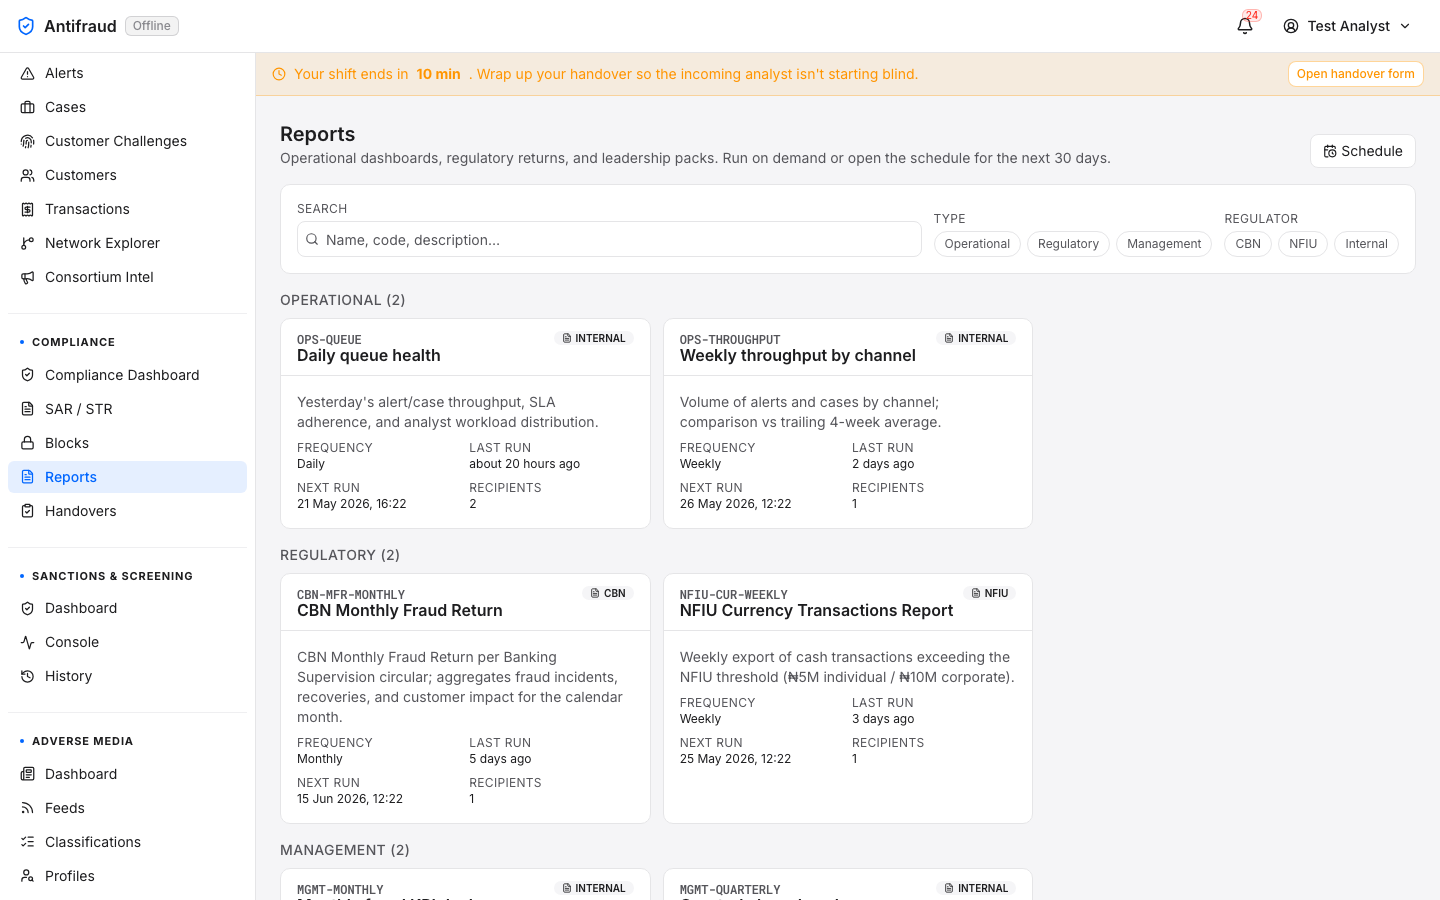
Reports catalogue
Compliance, executives/reports
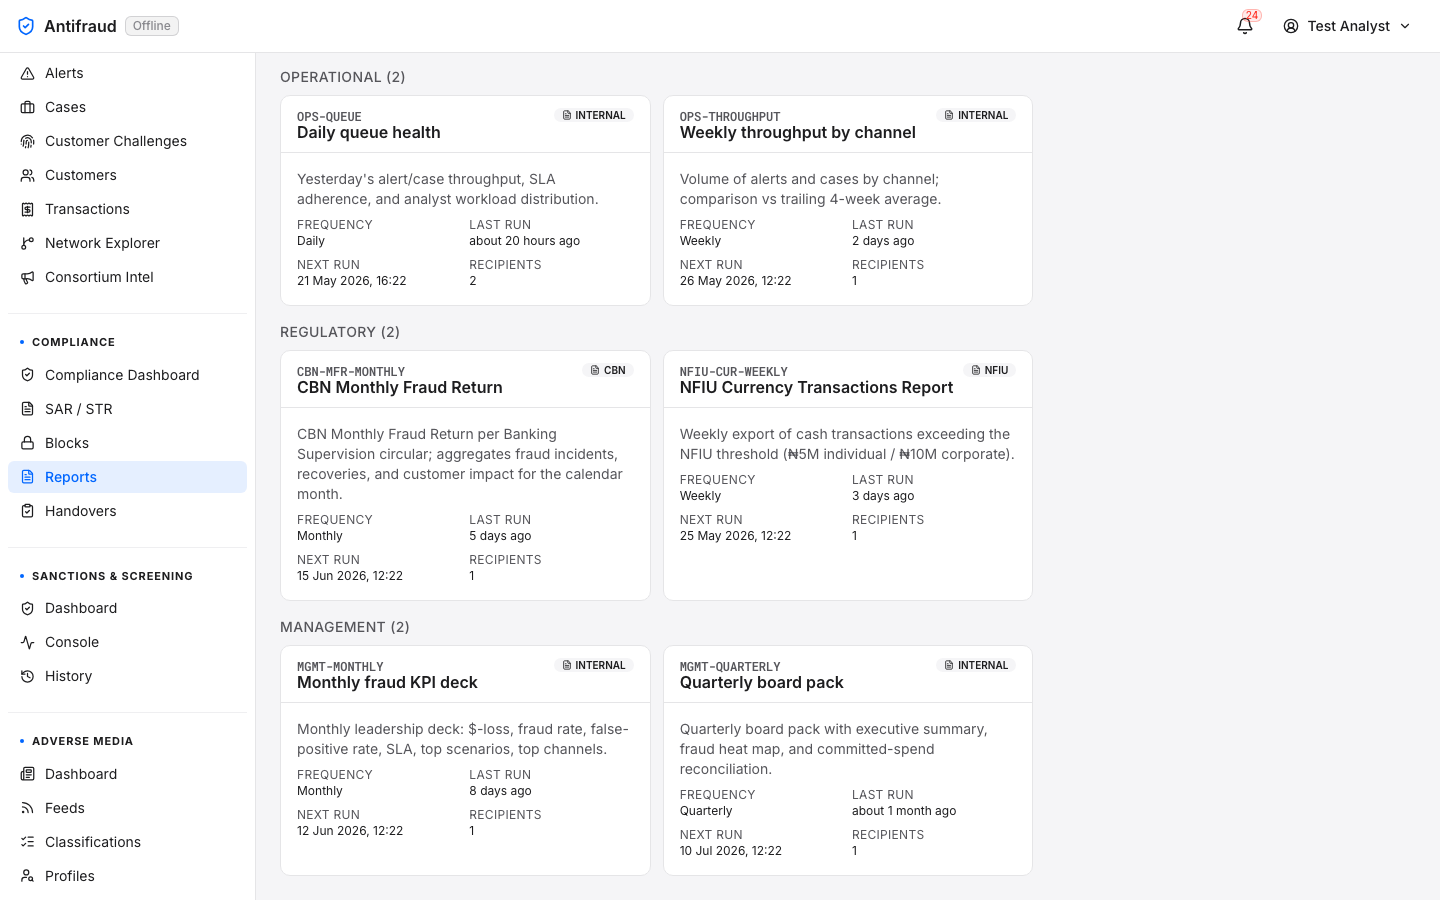
The catalogue of every report the platform can produce — standing regulatory returns, internal MI, scheduled email-outs and ad-hoc exports. Each report tile shows the last-run timestamp and links to the detail page where you can run it again or schedule it.
Figure 3.6a — Reports catalogue (top). Catalogue cards grouped by category — regulatory, MI, operational, ad-hoc.Figure 3.6b — Reports catalogue (bottom). Additional cards and the All reports link.
Report scheduling
Compliance, administrators/reports/schedule
Where regulatory and MI reports are scheduled to run. Schedule by cron, set recipients, choose the delivery channel (email, SFTP, secure download) and the retention policy.
Figure 3.7a — Report scheduling (top). Active schedules with next-run and last-run timestamps.Figure 3.7b — Report scheduling (middle). Schedule editor — cron expression, recipients, delivery channel.Figure 3.7c — Report scheduling (bottom). Run history and failure diagnostics.
NoteScheduled reports run as a system identity, not as the user who created the schedule. The user is recorded as the schedule owner for audit purposes.
Handovers
Analysts/handovers
Shift work demands explicit handover. At the end of every shift, the analyst documents the open work, blocks the incoming shift will pick up, and any context that did not make it into the case or alert comments. The Handovers page is the durable record of those notes — searchable across shifts and never deleted.
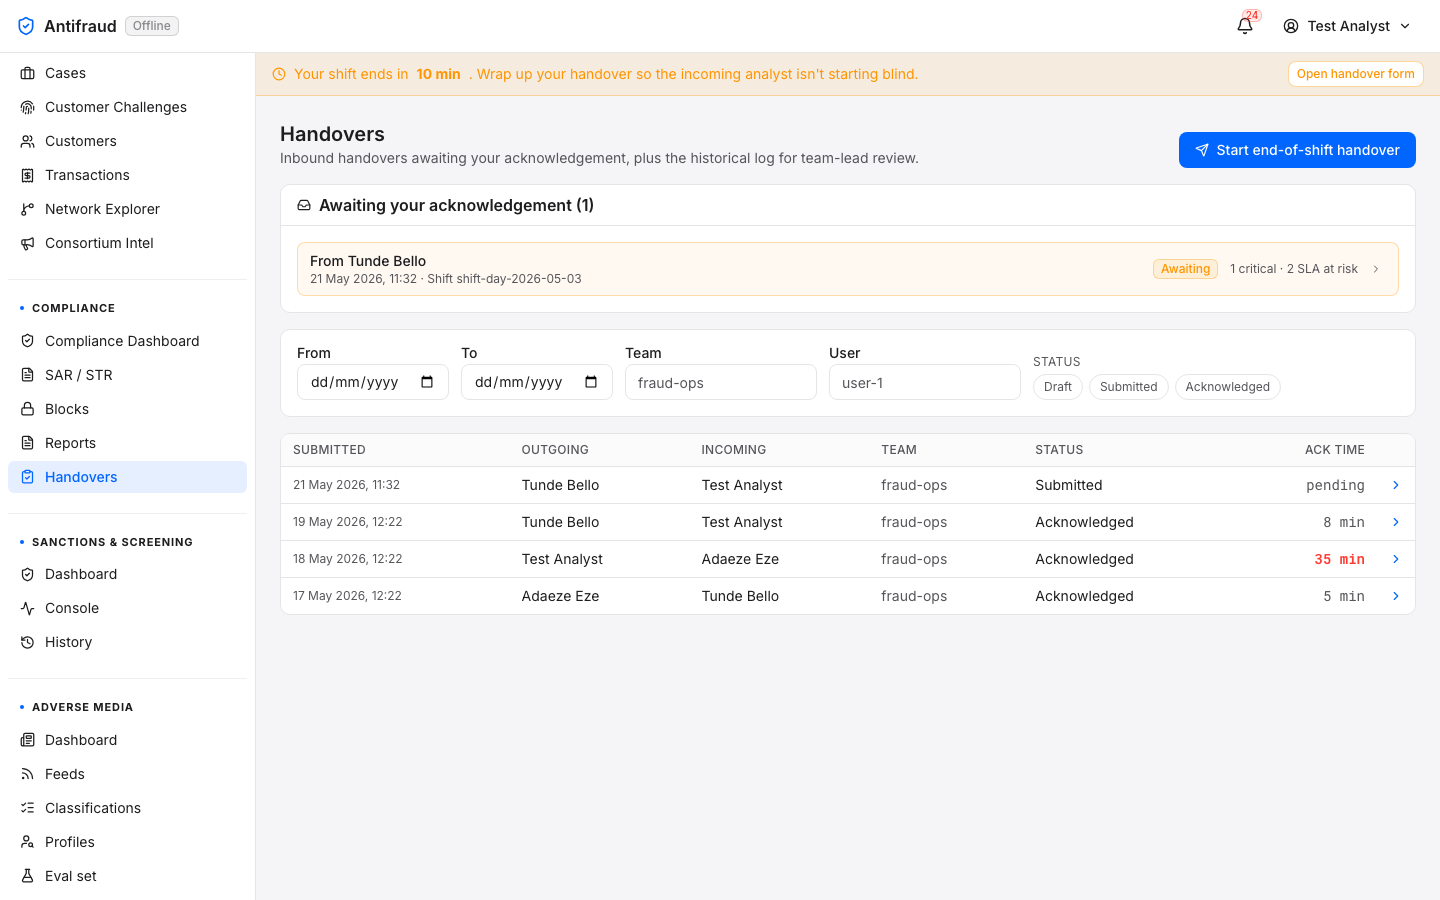
Figure 3.8 — Handovers log. Every shift handover, by analyst, queue and timestamp. Click a row to read the full note.
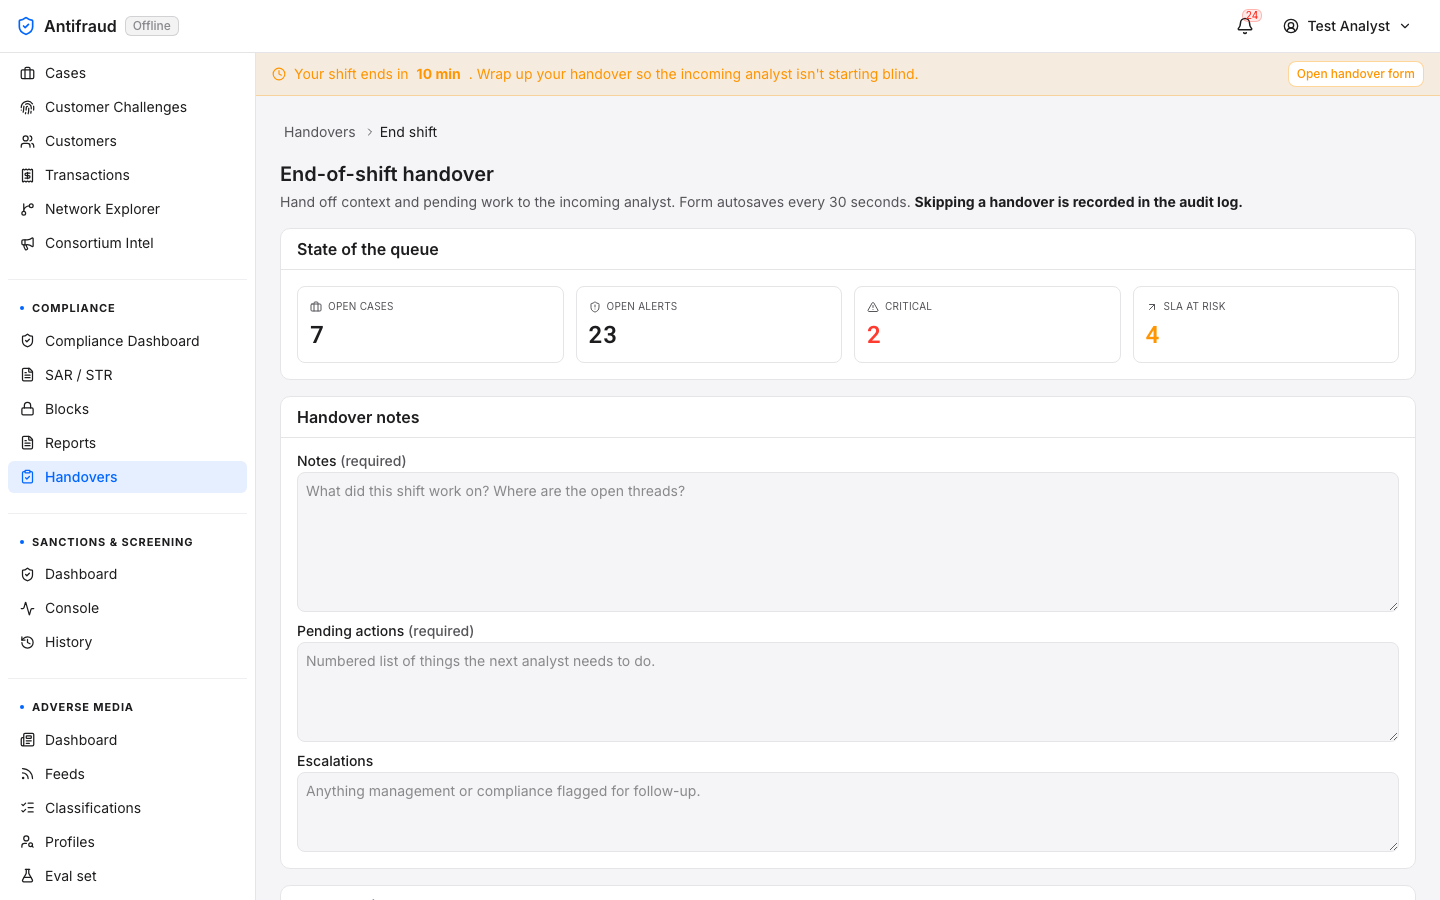
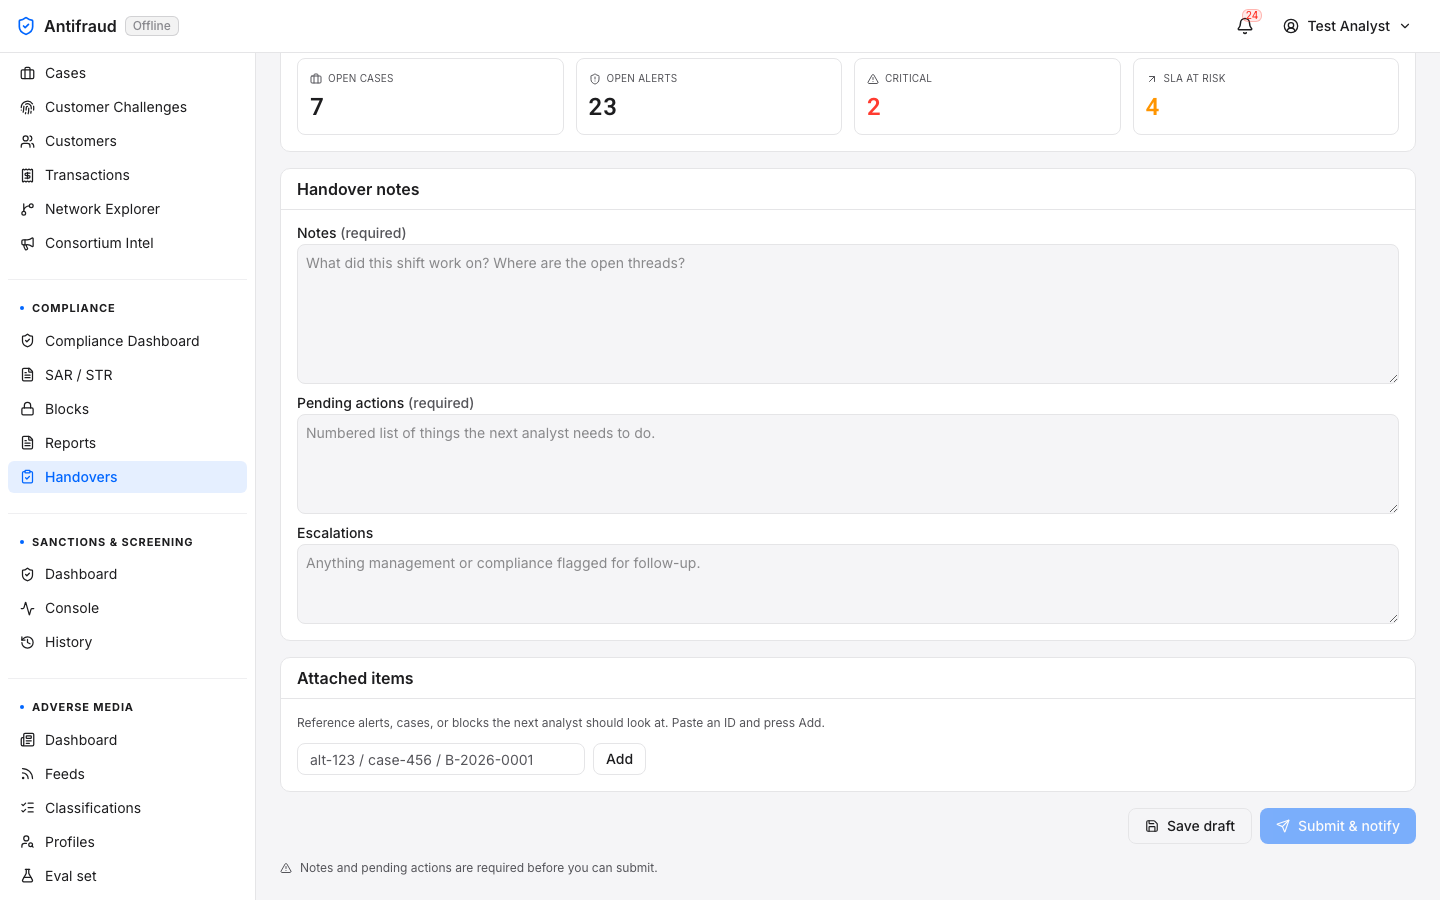
End-of-shift form
Analysts/handovers/end-shift
The structured form that an analyst fills in before signing out. The platform reminds the analyst to file it in the last ten minutes of the shift.
Figure 3.9a — End-of-shift form (top). Open cases, outstanding actions, escalations.Figure 3.9b — End-of-shift form (bottom). Free-text note and submit button.
TipThe form is fastest if you keep the case ids in a sticky note all shift. Paste them in; the platform looks them up and renders rich previews.
Sanctions & Screening
Sanctions, PEP and watchlist screening — the AML-style surface that sits alongside fraud monitoring.
Screening evaluates customers, counterparties and beneficiaries against sanctions lists (OFAC, EU, UK, UN), PEP databases and the institution's internal watchlist. Every customer onboarded is screened; every high-value transaction is screened against the beneficiary; and any analyst can run an ad-hoc check from the Console.
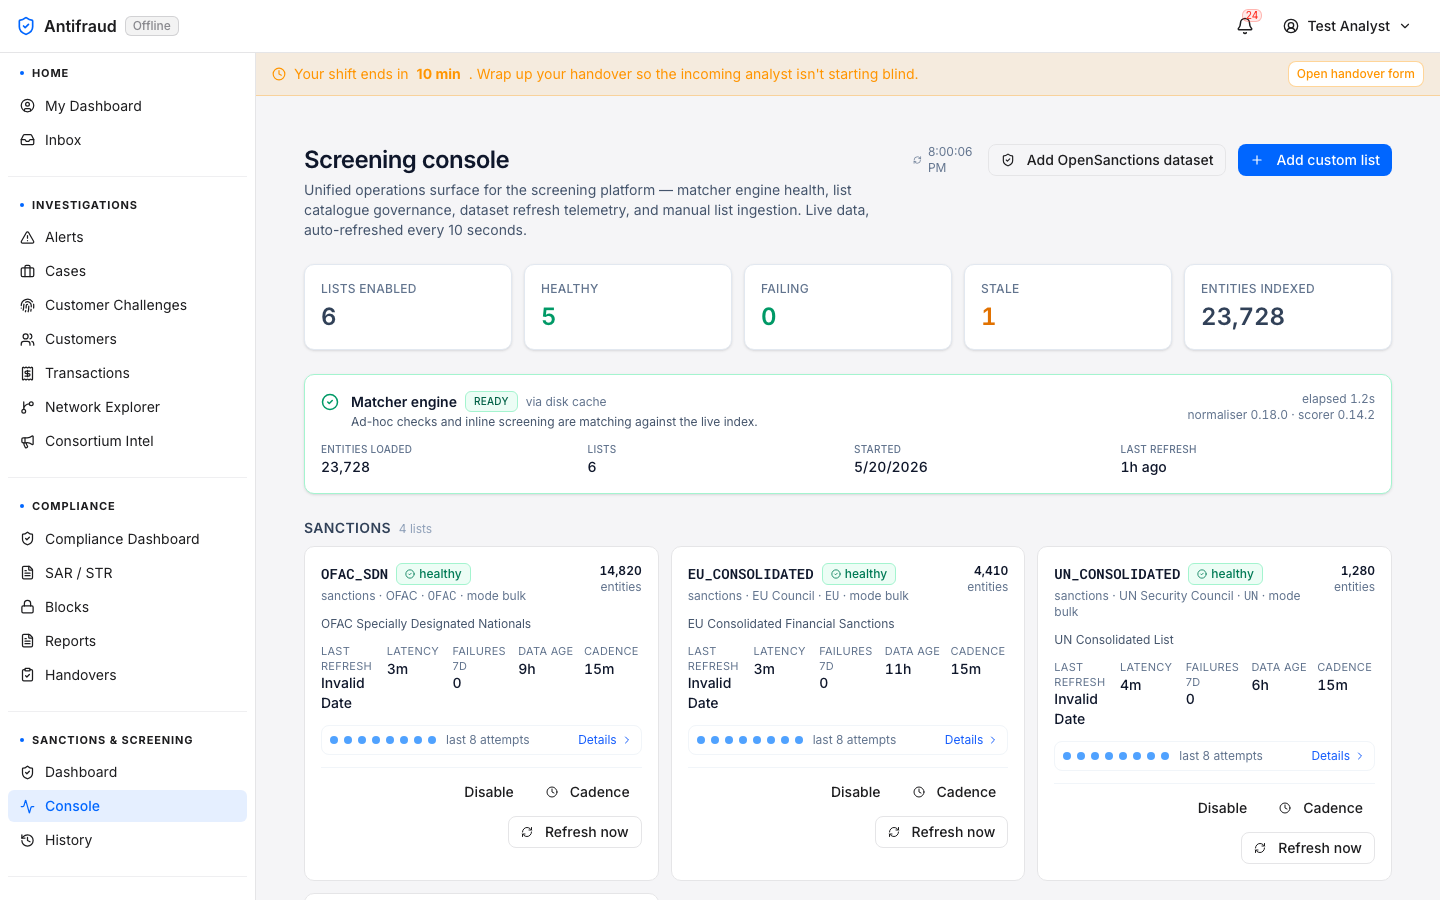
Operator workspace for the screening engine — engine status, list catalogue, real-time activity. The page folds in what used to be a separate "Sources" tab; it now shows every list source the platform consumes, its last-refresh timestamp, and its current matcher status.
Figure 4.2 — Screening console (admin view). Header "Screening console — Unified operations surface for the screening platform — matcher engine health, list catalogue provenance, dataset refresh telemetry, and manual list ingestion." Top KPI strip: Lists enabled 6, Healthy 5, Stale 0, Failed 1, Entities indexed 23,728. Engine card shows Matcher engine ready with 23,728 entities loaded across 6 lists, source cache_hit, normaliser 0.18.0 / scorer 0.14.2, last completed at 5:30 today. Sanctions sub-section below carries one card per list — OFAC_SDN (healthy · 14,820 entities · cadence 15m · last refresh "now"), EU_CONSOLIDATED (healthy · 4,410 · 15m), UK_HMT (stale · 2,910 · last refresh > 24h ago — flagged) with Disable / Cadence / Refresh now affordances on every card. Console is the active tab in the Sanctions & Screening module submenu, with Sanctions & Screening highlighted in the left sidebar.
What you can do here
Force-refresh a list source (where allowed by the source provider).
Inspect a matcher's behaviour against a sample subject.
Run an ad-hoc screen by typing a name, BVN or organisation.
Screening history
Compliance, analysts/screening/history
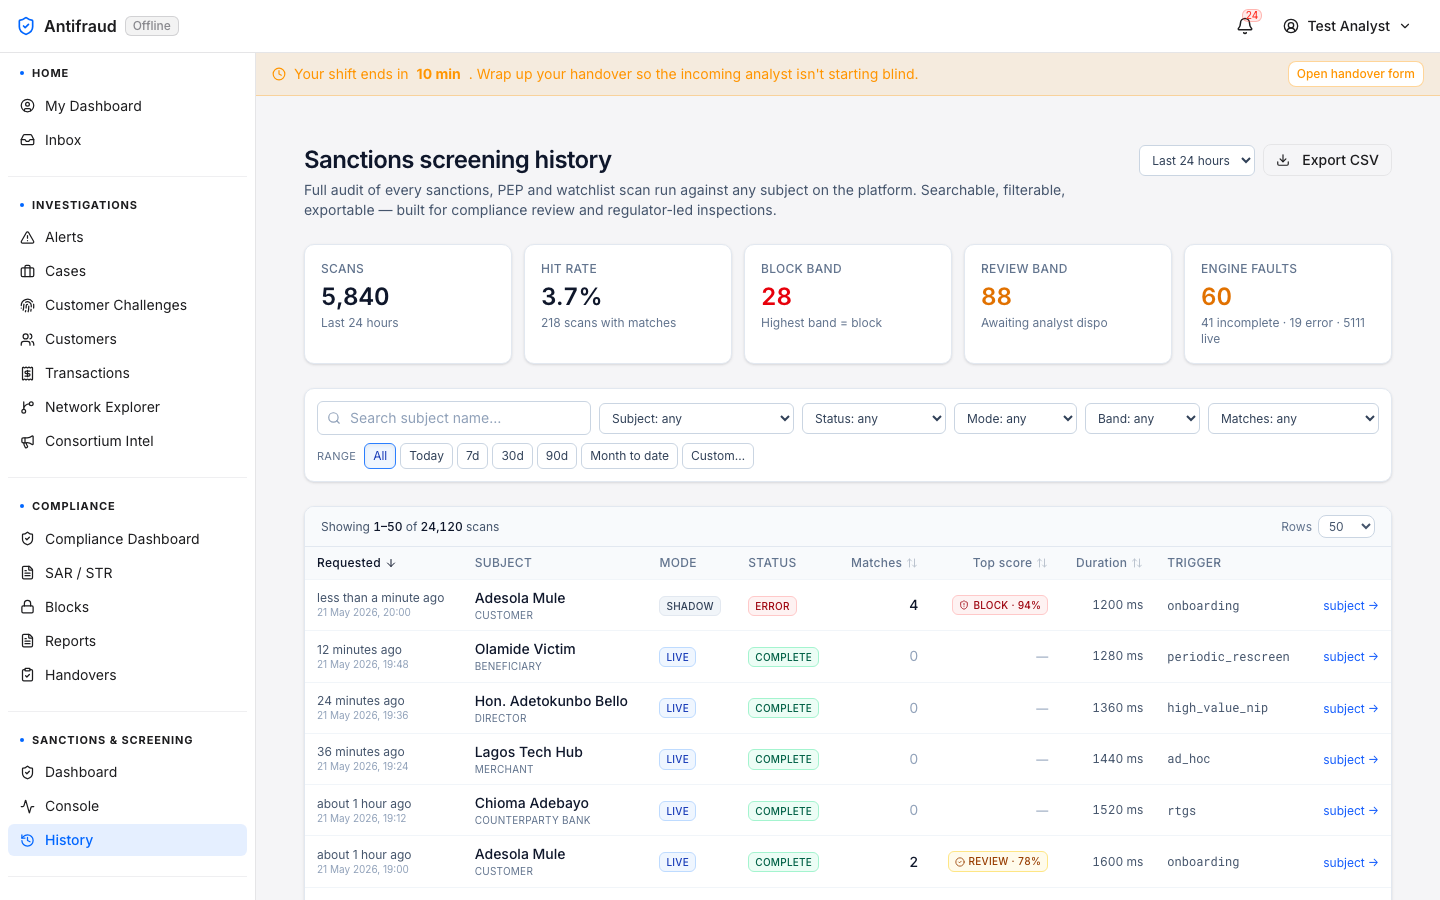
Searchable history of every screening run — who ran it, against what subject, against which lists, what matched, what was overridden. The regulator-facing audit trail.
Figure 4.3 — Screening history (admin view). Title Sanctions screening history with subtitle "Full audit of every alert/onboard, PEP and watchlist scan run against any subject on the platform. Searchable, filterable, exportable — built for compliance teams and inspectors." A 30-day KPI strip carries five tiles — Scans 5,840, Hit Rate 3.7%, Block Band 28, Review Band 88, Hits Today 60 — with the "Last 24h" period chip selected. Filter row beneath: Search · Subject type · Status · Mode · Band · Matches presence toggle · Export CSV. Results table shows recent rows: Adesola Mule (customer · live · complete · weak band · invalid date), Hon. Adetokunbo Bello (related party · live · complete · weak), Lagos Tech Hub (merchant · live · complete · 2 matches · review band), Chioma Adebayo (customer · live · complete · 2 matches · review). Each row is clickable to open the per-screening detail. History is the active tab in the Sanctions & Screening module submenu, with Sanctions & Screening highlighted in the left sidebar.
Adverse Media
LLM-classified mentions of customers and counterparties in news and the open web.
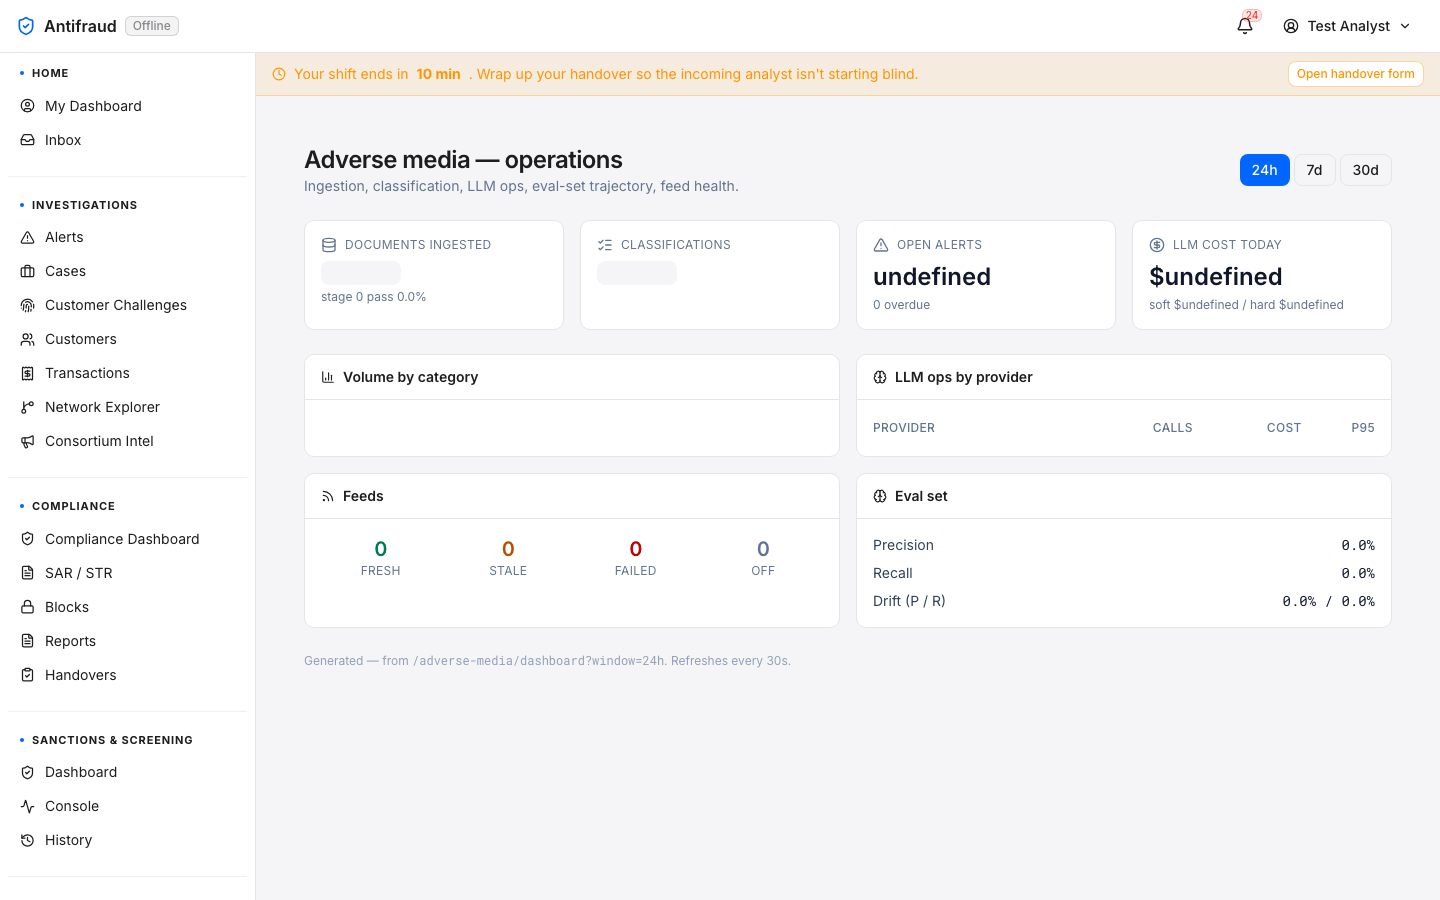
The Adverse Media track is the sister to Sanctions & Screening. It pulls news and watchdog feeds, runs them through a hash-pinned prompt against a governed LLM, and yields a per-mention classification with a citation trail. Subjects with persistent adverse mentions are graded into a durable risk tier on the Profiles page.
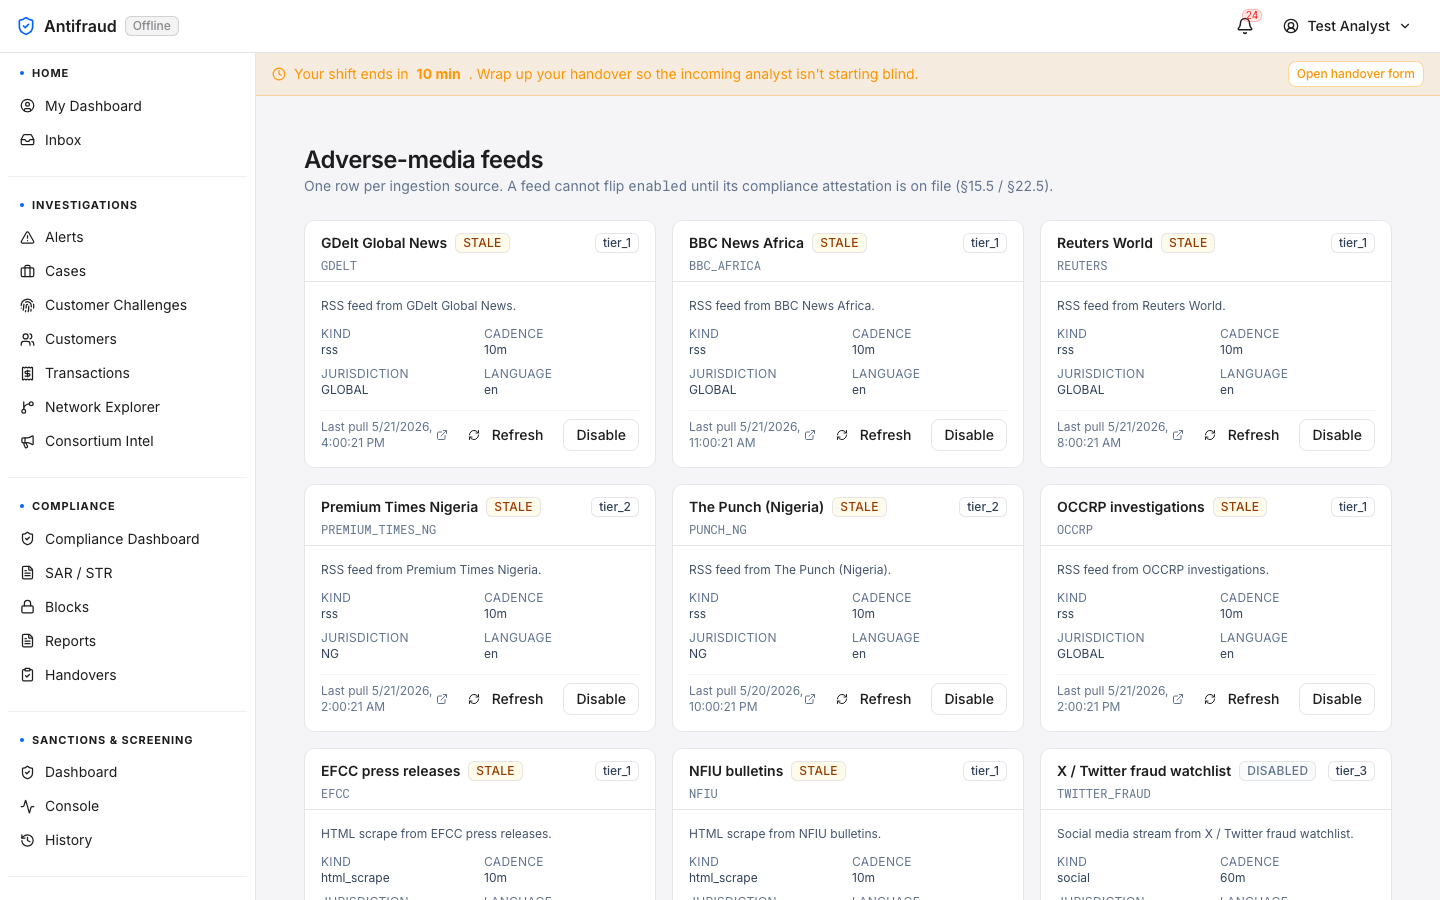
Catalogue of every news and watchdog feed the platform ingests. New feeds can be enabled only through an attestation gate — the operator confirms the feed is licensed for the institution's jurisdiction before traffic flows.
Figure 5.2 — Adverse-media feeds (admin view). Title Adverse-media feeds with the standing note "One row per ingestion source. A feed cannot flip enabled until its compliance attestation is on file (§15.5 / §22.5)." The catalogue renders as a card grid — GDelt Global News (RSS · tier_1 · GLOBAL · healthy · last pull 4m ago), BBC News Africa (RSS · tier_1 · healthy · 9m ago), Reuters World (RSS · tier_1 · healthy · 12m ago), Premium Times Nigeria (RSS · tier_2 · NG · healthy · 18m ago), The Punch (Nigeria) (RSS · tier_2 · healthy · 22m ago), OCCRP investigations (RSS · tier_1 · healthy · 6m ago), EFCC press releases (HTML scrape · tier_1 · NG · healthy · 14m), NFIU bulletins (HTML scrape · tier_1 · stale · 40m ago), X / Twitter fraud watchlist (social · tier_3 · disabled · last successful pull 4 days ago, 8 consecutive failures). Each card carries Refresh and Disable affordances (gated on attestation). Feeds is the active tab in the Adverse Media module submenu, with Adverse Media highlighted in the left sidebar.
CautionDisabling a feed does not delete the classifications it already produced. To purge classifications, use the data-retention controls on the Profiles page.
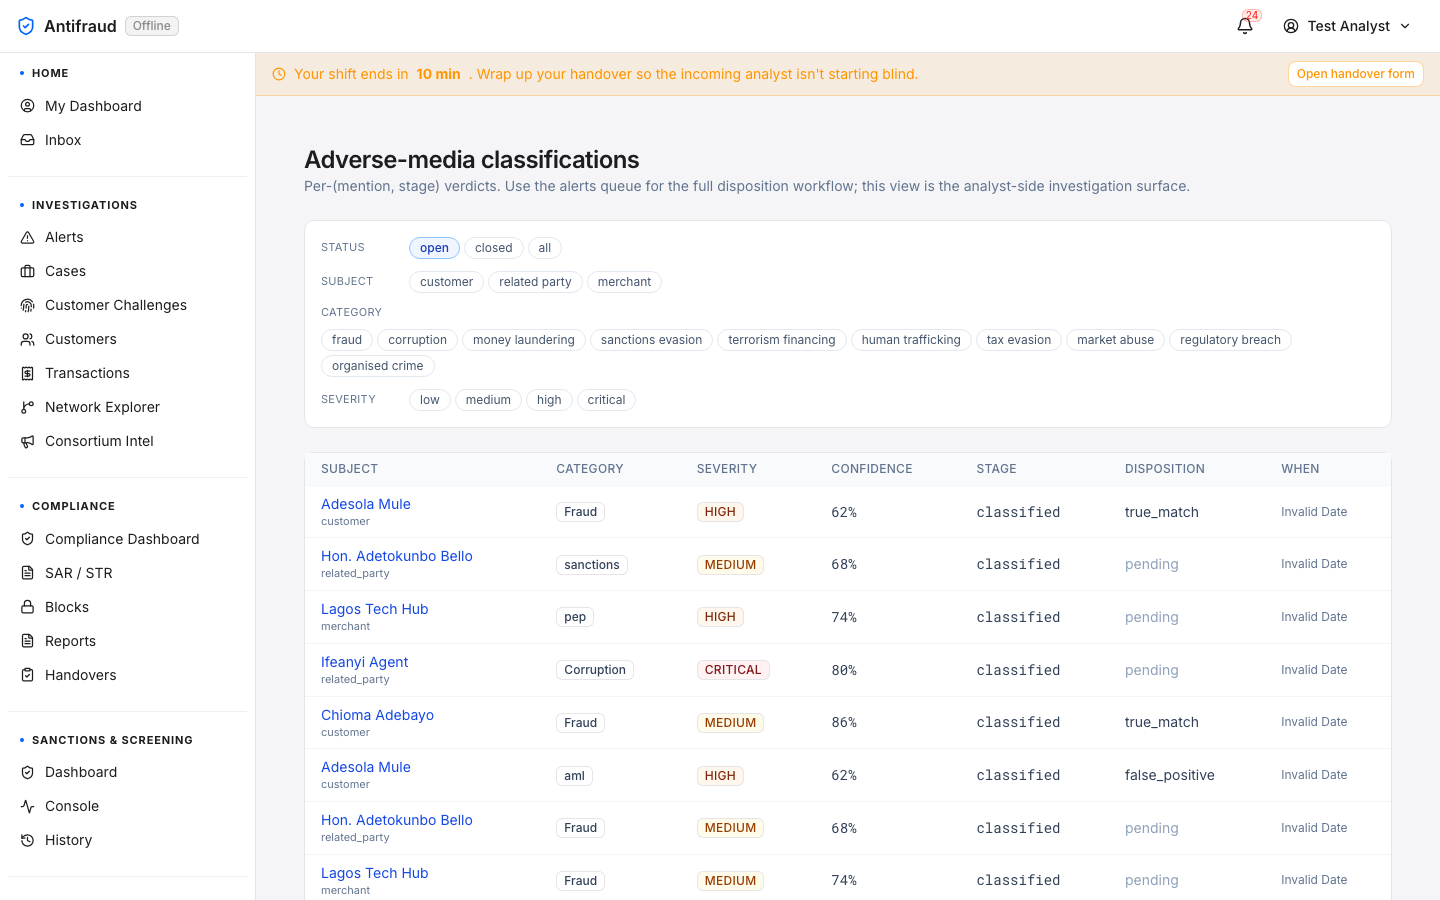
Per-mention LLM verdicts. Each row shows the subject, the verdict, the source, the prompt version that produced it, and the citation trail. Verdicts can be challenged — a challenged classification opens a review workflow and is excluded from the subject's profile aggregation while the challenge is open.
Figure 5.3 — Adverse-media classifications (admin view). Title Adverse-media classifications with subtitle "Per-(mention, stage) verdicts. Use the alerts queue for the full disposition workflow; this view is the analyst-side investigation surface." Filter strip across the top: Status (open · closed · all), Subject (customer · related party · merchant), Category (fraud, corruption, money laundering, sanctions evasion, terrorism financing, human trafficking, tax evasion, market abuse, regulatory breach, organised crime), Severity (low · medium · high · critical). Results table columns — SUBJECT, CATEGORY, SEVERITY, CONFIDENCE, STAGE, DISPOSITION, WHEN — populated with 10 rows: Adesola Mule (Fraud · high · 62% · classified · true_match), Hon. Adetokunbo Bello (sanctions · medium · 68% · classified · pending), Lagos Tech Hub (pep · high · 74% · classified · pending), Ifeanyi Agent (Corruption · critical · 80% · classified · pending), Chioma Adebayo (Fraud · medium · 86% · classified · true_match), then a second batch of fraud/aml/corruption rows with mixed dispositions (false_positive, pending). Click any row to open the per-classification detail with the citation trail. Classifications is the active tab in the Adverse Media module submenu, with Adverse Media highlighted in the left sidebar.
Risk profiles
Compliance officers/adverse-media/profiles
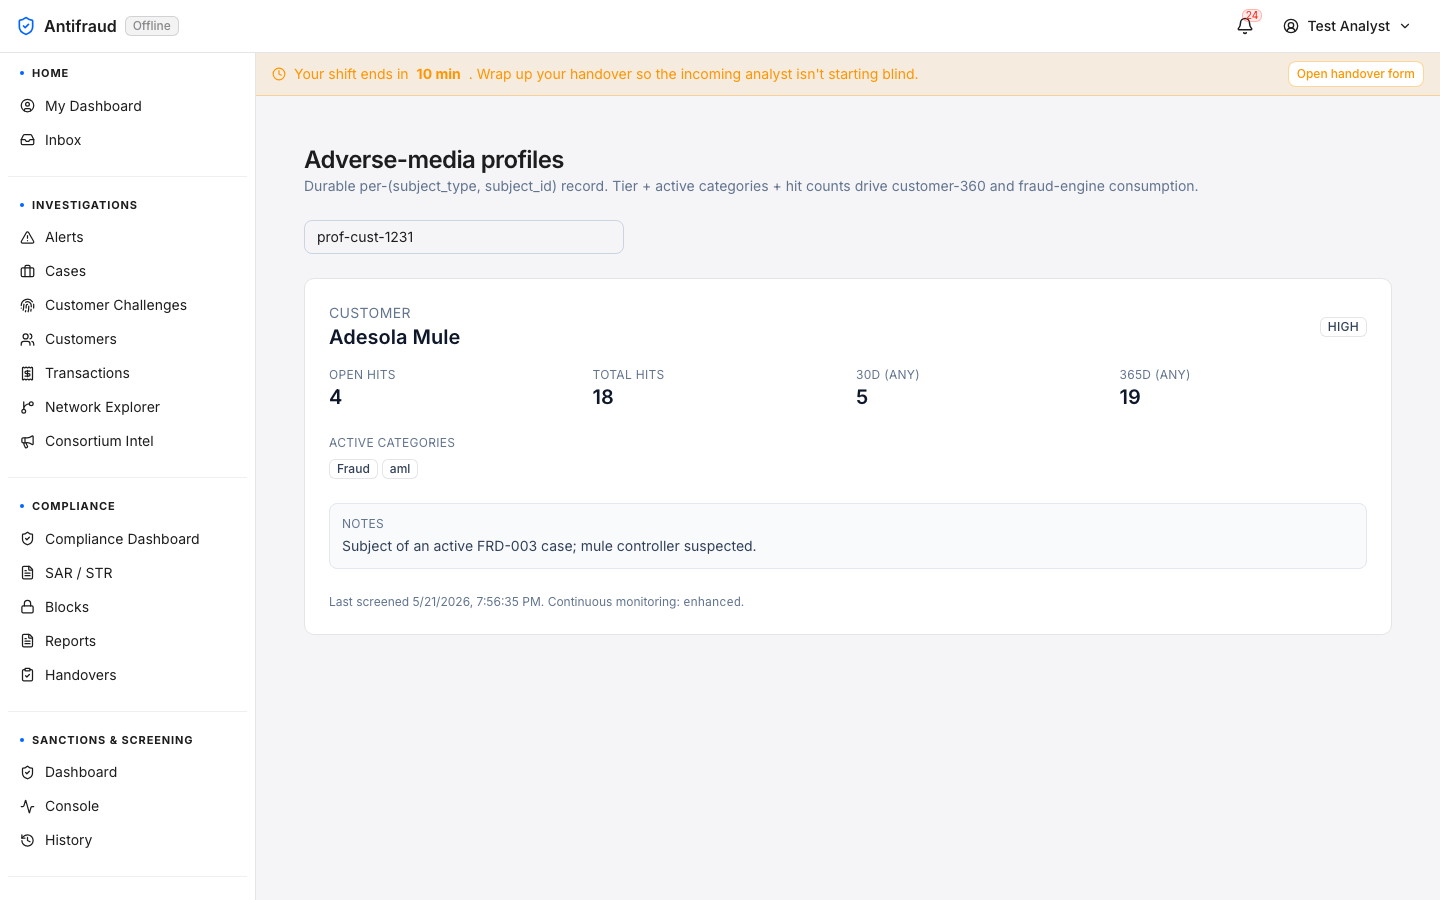
The durable per-subject view. The profile aggregates every classification across time, weighs them by recency and severity, and assigns a risk tier (Low, Medium, High, Critical) used by downstream Customer 360.
Figure 5.4 — Adverse-media risk profiles (admin view). Title Adverse-media profiles with the standing brief "Durable per-(subject_type, subject_id) record. Tier + active categories + hit counts drive customer-360 and fraud-engine consumption." Lookup field carries the default profile id prof-cust-1231. The profile card below renders the durable record for the customer subject Adesola Mule with a HIGH risk tier badge top-right. Hit counters: Open hits 4, Total hits 18, 30d (any) 5, 365d (any) 19. Active categories: Fraud · aml. Notes: "Subject of an active FRD-003 case; mule controller suspected." Footer line: "Last screened 5/21/2026, 7:56:35 PM. Continuous monitoring: enhanced." Profiles is the active tab in the Adverse Media module submenu, with Adverse Media highlighted in the left sidebar.
Eval set
Compliance owners/adverse-media/eval-set
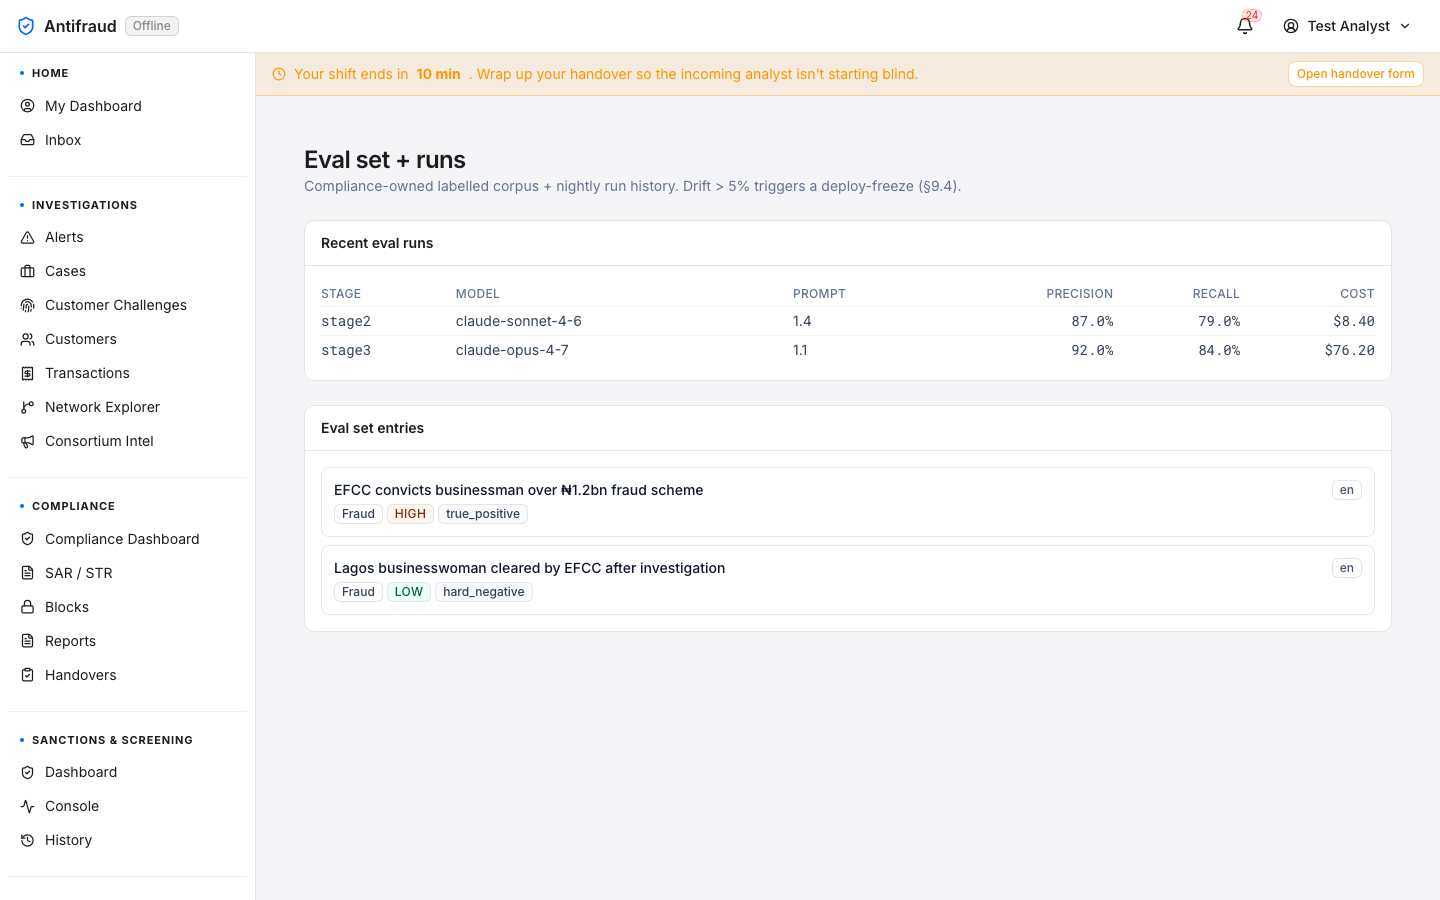
The labelled corpus that the compliance team owns. New prompt versions are evaluated against the eval set before they are promoted to production. If the eval-set scores drop, the deployment is blocked.
Figure 5.5 — Eval set. Compliance-owned labelled examples — the gate every prompt change must clear.
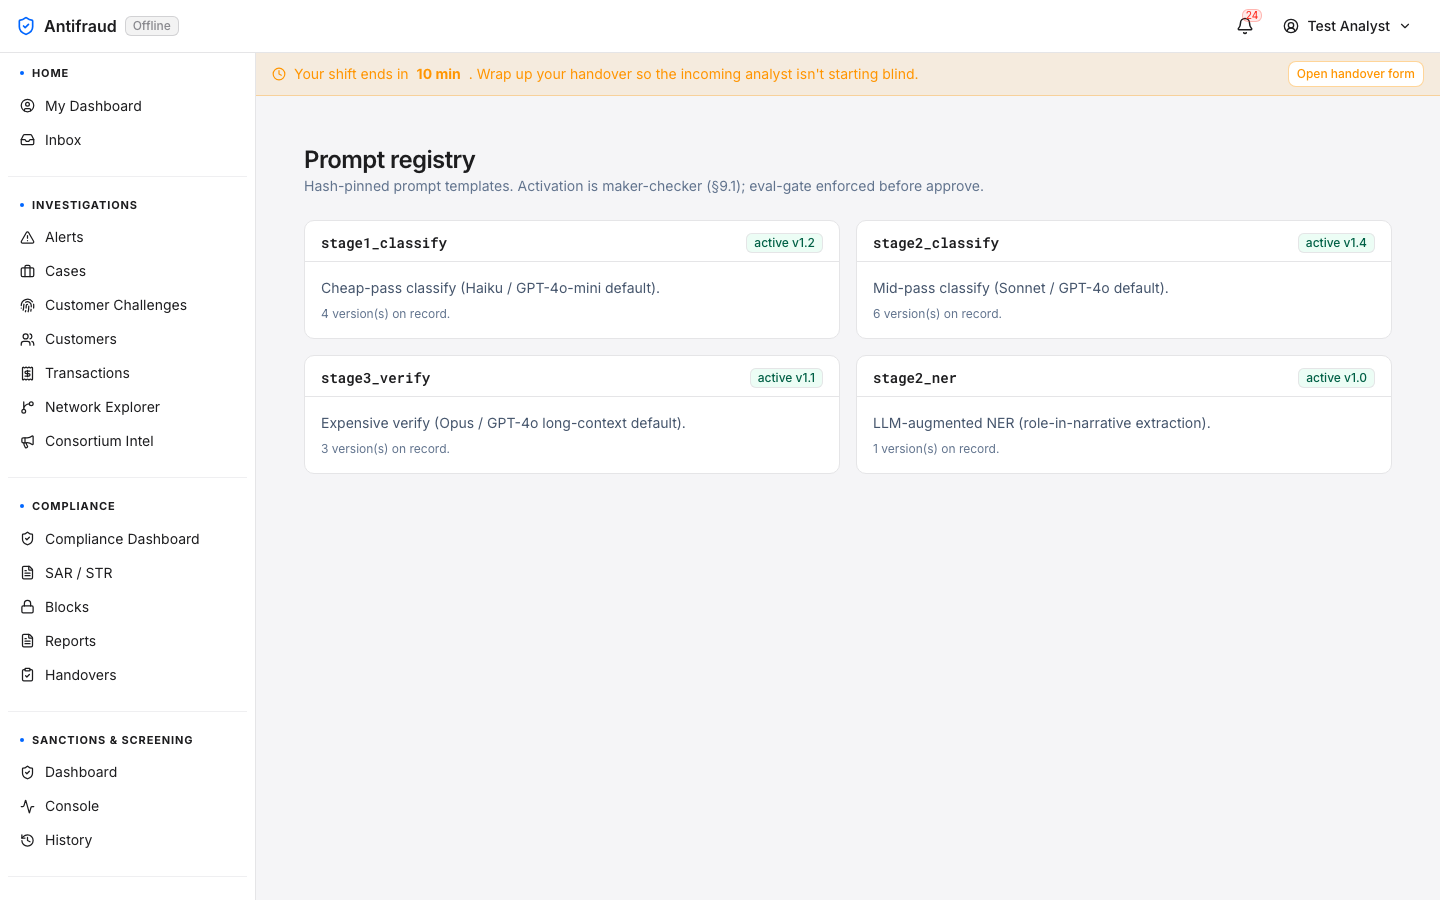
The hash-pinned prompt registry. Every prompt is stored with its SHA, the model it targets, the eval-set score at promotion, the operator who promoted it and the timestamp. Production traffic always runs against a pinned version — never against a freshly-edited draft.
Figure 5.6 — Prompt registry. Pinned prompt versions with scores and promotion lineage.
CriticalPromoting a new prompt without an updated eval-set score is gated and audited. Skipping the eval is not possible from the UI; it can only be done from the API by an emergency override role.
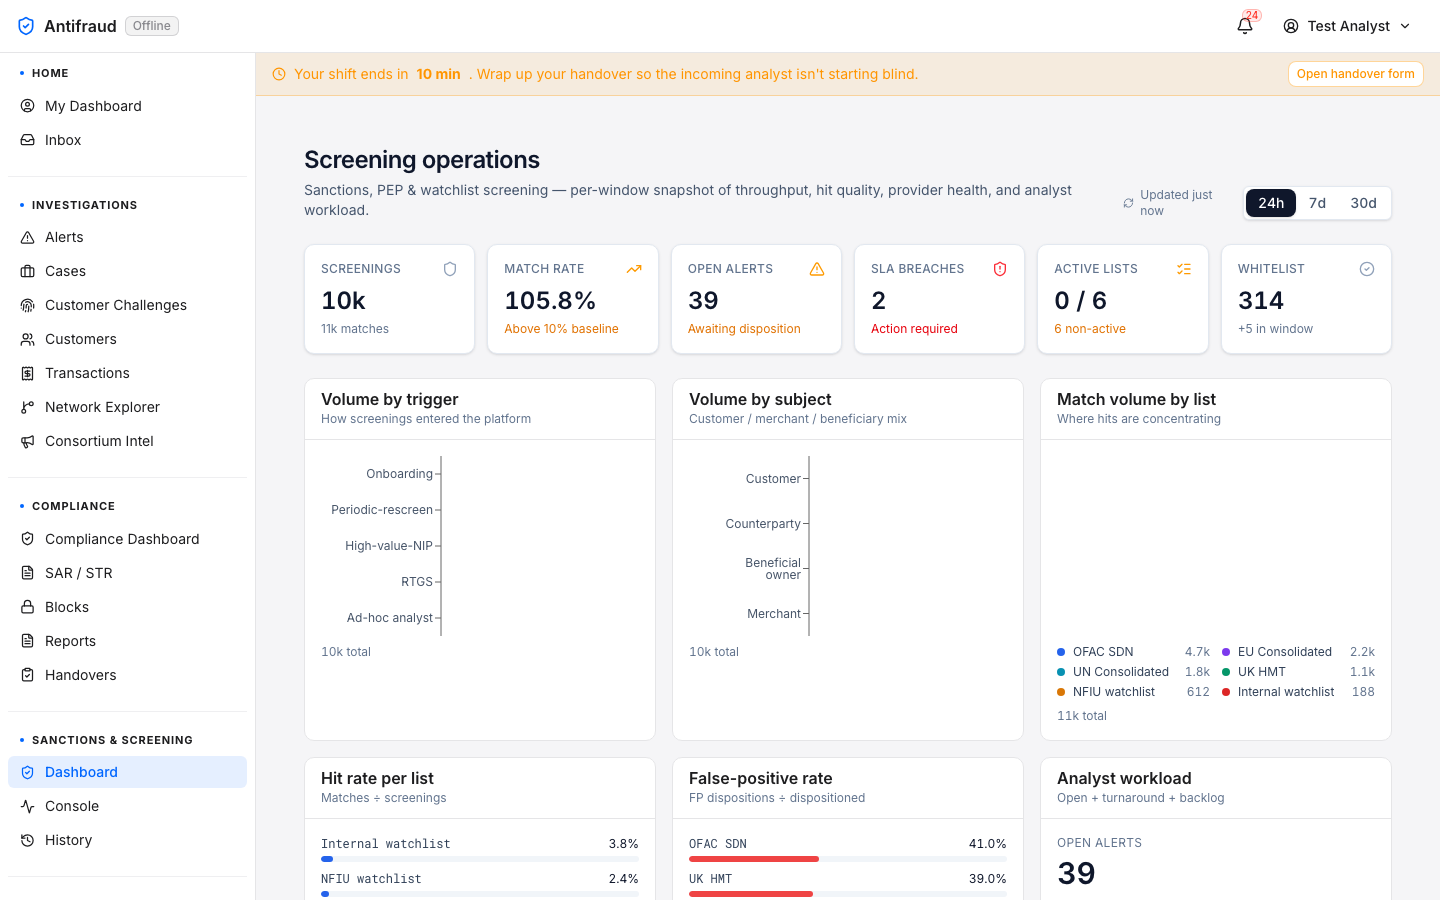
Dashboards
Every analytical roll-up across the institution — executive, risk, operations, branch, role-based.
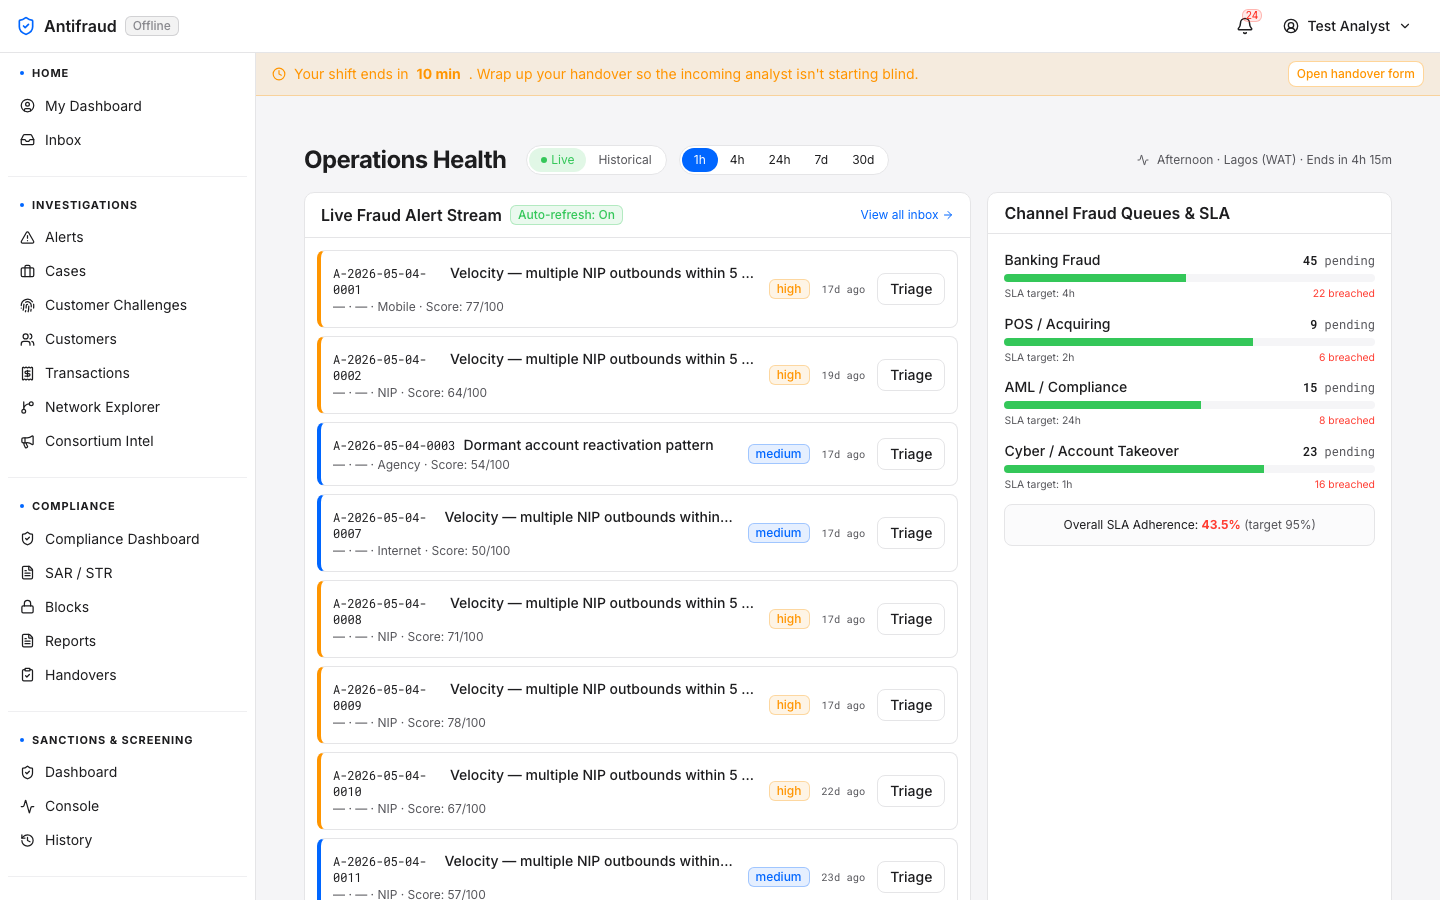
Dashboards is the portfolio of views the institution uses to understand its fraud posture in aggregate. Each dashboard has a different audience and a different cadence — the Executive Dashboard is read in board meetings; Operations Health is up on the SOC wall; Risk Heatmap is a 30-day strategic view; the HQ Rollup compares branches and lines of business.
One-screen, regulator-presentable view of the institution's fraud posture across every channel.
Audience
Executives (CRO, COO, Head of Fraud), system administrators, and anyone granted system:admin. Doubles as the My Dashboard landing for these roles.
When to use
Daily review at the start of the morning standup. Before board meetings. When an incident report cites a fraud volume number that needs checking.
The Executive Dashboard is the institution's at-a-glance picture of fraud across every channel the platform monitors — Agency, Internet, Mobile, ATM, POS, USSD & NIP. It pulls live aggregates from the analytics service and renders six bands of cards: Outcome Split, KPI strip, Decision Volume, Channel Mix, Top Rules by Volume and Active Models. The time window is operator-controlled with one click.
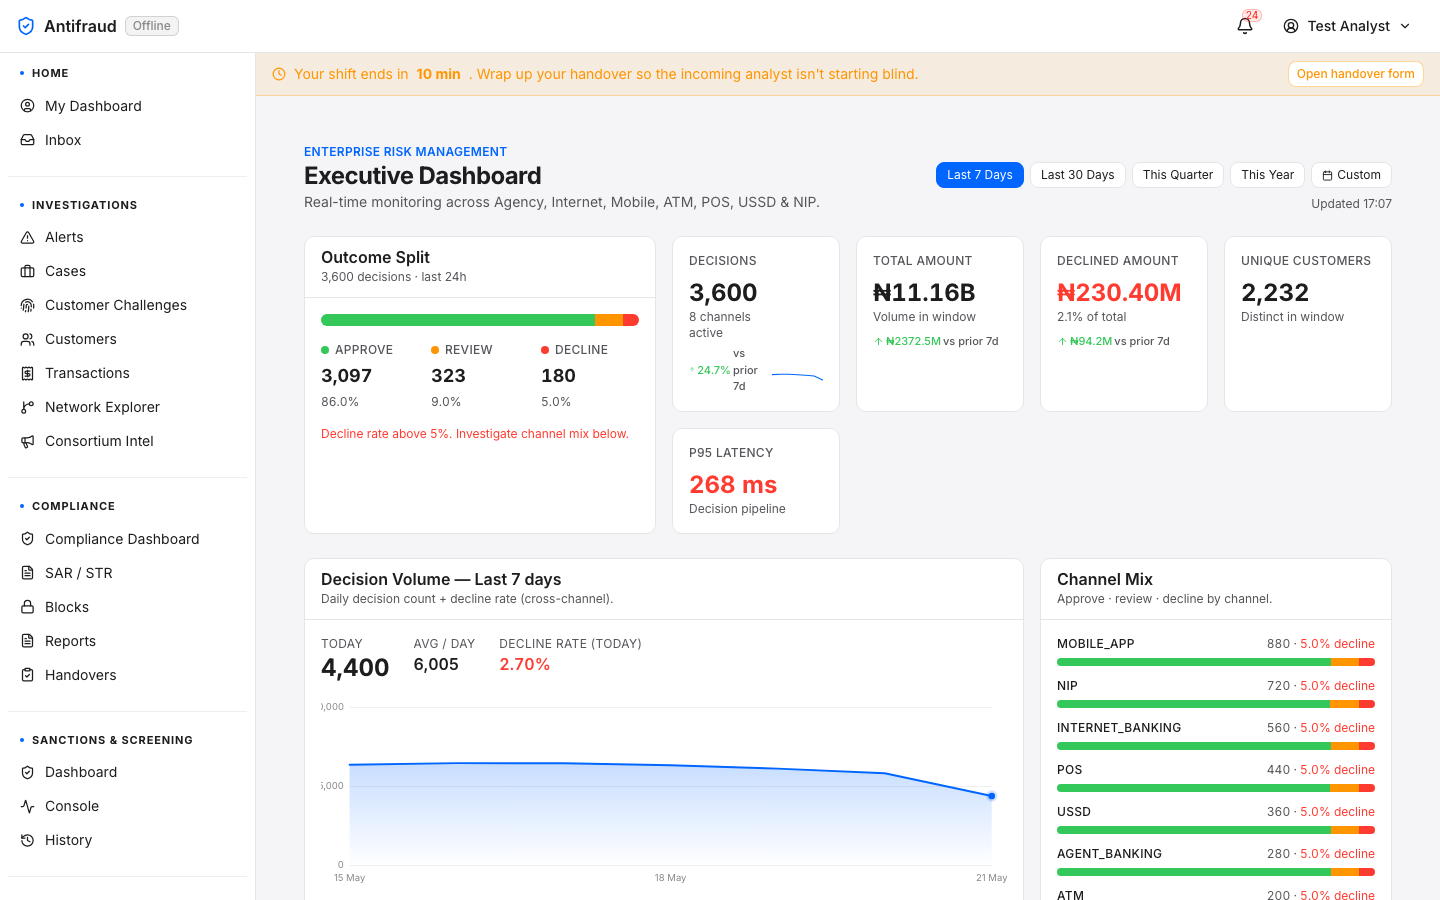
Figure 6.1a — Executive Dashboard (top, Last 30 Days). Eyebrow Enterprise Risk Management; title Executive Dashboard; subtitle "Real-time monitoring across Agency, Internet, Mobile, ATM, POS, USSD & NIP." Period selector top-right with five chips (Last 7 Days, Last 30 Days selected, This Quarter, This Year, Custom) and an "Updated 17:07" freshness stamp underneath. Top row: Outcome Split card (3,600 decisions, last 24h — 3,097 approve at 86.0%, 323 review at 9.0%, 180 decline at 5.0%, with the inline guardrail copy "Decline rate above 5%. Investigate channel mix below." in red); KPI strip — Decisions 3,600 with 8 channels active and a +1.6% delta sparkline vs prior 30d; Total Amount ₦11.16B with ₦2382.7M vs prior 30d; Declined Amount ₦230.40M (2.1% of total) with ₦355.6M vs prior 30d; Unique Customers 2,232; P95 Latency 268 ms on the decision pipeline. Second row: Decision Volume — Last 30 days with the headline triple (TODAY 4,400 · AVG/DAY 4,719 · DECLINE RATE (TODAY) 2.70%) above a 30-day sparkline; Channel Mix stacked-bar tile listing every channel (MOBILE_APP 880, NIP 720, INTERNET_BANKING 560, POS 440, USSD 360, AGENT_BANKING 280, ATM 200, RTGS 160) with the approve / review / decline split rendered in green / amber / red.Figure 6.1b — Executive Dashboard (bottom).Top Rules by Volume — Last 7 Days card with hits + outcome breakdown for each fired rule: FRD-003 High-velocity NIP burst (18,342 hits, 7% declined), FRD-005 Name-enquiry mismatch on high-value NIP (8,911 / 17%), FRD-002 POS authorisation outside customer pattern (6,432 / 10%), FRD-001 Profile change followed by high-value transfer (5,219 / 11%), FRD-006 USSD session anomaly with SIM-swap signal (3,987 / 16%), FRD-009 Cross-border wire to high-risk corridor (2,103 / 12%), FRD-008 Agent cluster cash-out concentration (1,762 / 8%). Each row carries a green / amber / red mini-bar visualising the approve / review / decline split. Active Models card lists fraud-scorer 2026.05.03 (PRODUCTION · active · AUC 0.974), ato-scorer 2026.04.18 (PRODUCTION · active · AUC 0.961), mule-detector 2026.04.05 (PRODUCTION · active · AUC 0.943) and sar-narrative-llm 2026.05.18 (SHADOW — under evaluation, not yet scoring).
Six bands, top-to-bottom
#
Band
What it shows
Source endpoint
1
Outcome Split
Approve · review · decline totals for the last 24 hours with the % of each. Inline guardrail copy fires when the decline rate crosses 5%.
GET /analytics/dashboard
2
KPI strip
Decisions · Total amount · Declined amount · Unique customers · P95 latency. Each tile carries a delta vs the prior period of equal length so the executive sees movement, not just level.
GET /analytics/dashboard
3
Decision Volume
Daily decision count and decline rate across the selected window. Today / Average / Today's decline rate above the sparkline so the eye lands on the leading indicator first.
GET /analytics/trends?days=<period>
4
Channel Mix
Per-channel bar with the approve / review / decline split in colour. The order is volume-descending so the busiest channel is on top.
GET /analytics/dashboard
5
Top Rules by Volume
The seven highest-volume rules in the last seven days with hit count, percentage declined and a coloured mini-bar of the outcome split. Reads the rules-performance endpoint, fixed to a 7-day window regardless of the page selector.
GET /analytics/rules/performance?days=7
6
Active Models
Every model in PRODUCTION or SHADOW state with version, status and the single most important metric (AUC for the scorers; exact-match for the LLMs). Inactive models are hidden.
GET /analytics/models/performance
NoteEvery band is empty-state-aware. If the analytics service has not produced a snapshot for the window — for example, immediately after a fresh deployment or a long maintenance window — the card explains the situation in plain English ("Either no traffic in window or the daily aggregator hasn't run") rather than rendering a blank chart.
The period selector
Five chips top-right control every band on the page except Top Rules (always 7d) and Active Models (always current). Switching a chip re-fetches the snapshot and trend endpoints in parallel; the existing render stays on screen until the new data lands so the page never flashes blank.
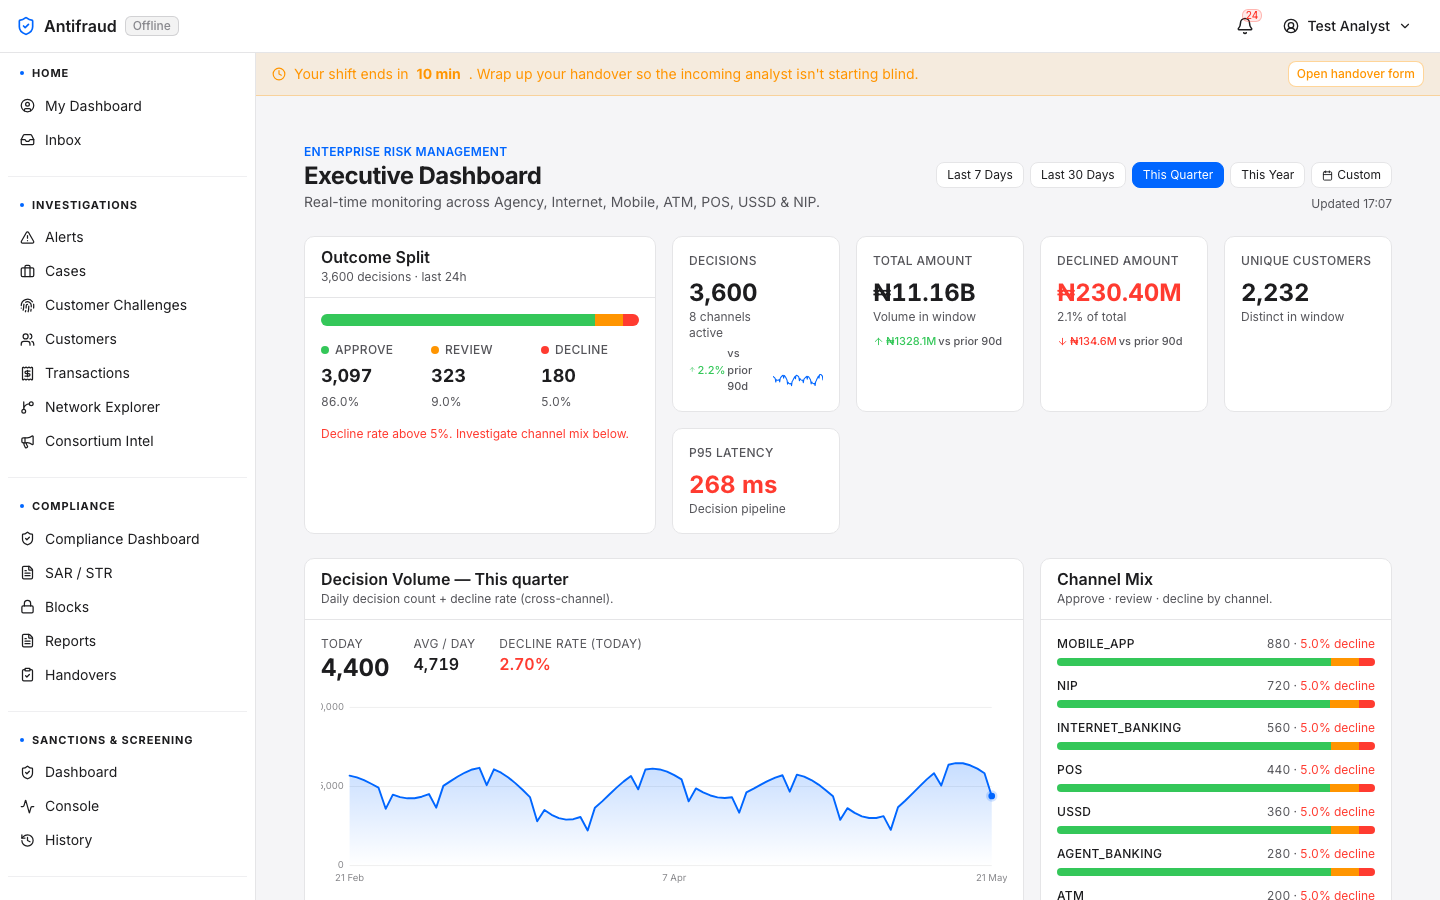
Figure 6.1c — Last 7 Days view. Selecting Last 7 Days updates the KPI tile deltas to compare against the previous 7-day window (+24.7% prior 7d on decisions), the Decision Volume sparkline collapses to a 7-point trend, and the chart x-axis re-anchors to "15 May → 21 May". The Channel Mix totals and the Outcome Split do not change because they are 24-hour and 8-channel-active aggregates respectively, not window-bound.Figure 6.1d — This Quarter view. Selecting This Quarter stretches the Decision Volume chart to ~90 daily points (21 Feb → 21 May) and recomputes the KPI deltas against the previous 90-day window (+2.2% prior 90d on decisions). The wave-and-swell pattern becomes visible — weekly dips on the 7-day cycle plus a longer ~30-day swell — exactly the kind of macro-trend an executive should be looking at.
How to read the page
Decline rate. Glance at the Outcome Split first. A decline rate above 5% triggers the inline guardrail; an analyst should already be investigating, but the executive needs to know.
Movement. Look at the KPI deltas. A +24% week is interesting; a −20% week may signal a broken integration upstream.
Where. Read the Channel Mix bars. Concentration on one channel can either be a normal pattern (NIP dominates most days) or a campaign — a sudden shift requires a follow-up.
Why. Read the Top Rules card. The rule producing the most hits is the institution's current dominant typology — for the captured snapshot, the velocity-NIP-burst rule (FRD-003) at 18,342 hits is the loudest signal.
What's scoring. Confirm the Active Models row. If a model that should be in production is missing, scoring is degraded; if a SHADOW model is producing better numbers than its PRODUCTION counterpart, schedule a promotion.
Permissions & access
The route is permission-filtered per module and page (system:admin here). The underlying /analytics/* endpoints all check audit:read, which is granted by the admin tier and a few other senior tiers; an executive who is not also an admin will see the dashboard through the My Dashboard shortcut.
Print-ready: the page passes through the platform's print stylesheet so File → Print produces a PDF suitable for board packs without bespoke formatting.
No PII is rendered. Every figure is an aggregate; no row drills down to a customer. The page is safe to screen-share inside the institution.
Operational notes
Freshness. The "Updated HH:MM" stamp is the window_end from the snapshot, not the page render time. If the stamp lags by more than a minute, the daily aggregator job may be stuck — check System status.
Sparkline scale. The Decision Volume chart auto-scales to the data — comparing two windows visually can mislead. Read the headline numbers above the chart for the actual values.
Top Rules is fixed to 7 days. Changing the period chip does not change the rule window. This is deliberate so the executive always sees the recent typology rather than a stale quarter average.
Latency tile. P95 latency is decision-pipeline latency end-to-end — not just the model. A sudden P95 spike is usually a databus or rules-service incident; cross-reference Operations health.
No customer drill-down. By design — this is the portfolio view. To investigate a specific signal, pivot to the Alerts queue filtered by the dominant rule, or the Trend analytics page for deeper time-series.
CautionThe Outcome Split's decline-rate guardrail is calibrated for the institution's normal posture. If you change rule thresholds or onboard a new channel, the 5% guardrail copy will fire constantly until the new normal stabilises. Adjust the threshold in SLA policy after a channel onboarding rather than ignoring the banner.
TipThe fastest sanity check after a deployment: open this page, confirm every band has data, glance at the "Updated" stamp. Three things prove the analytics, rules-performance and models-performance endpoints are all alive — which means most of the platform is too.
Trend analytics
Risk team/analytics
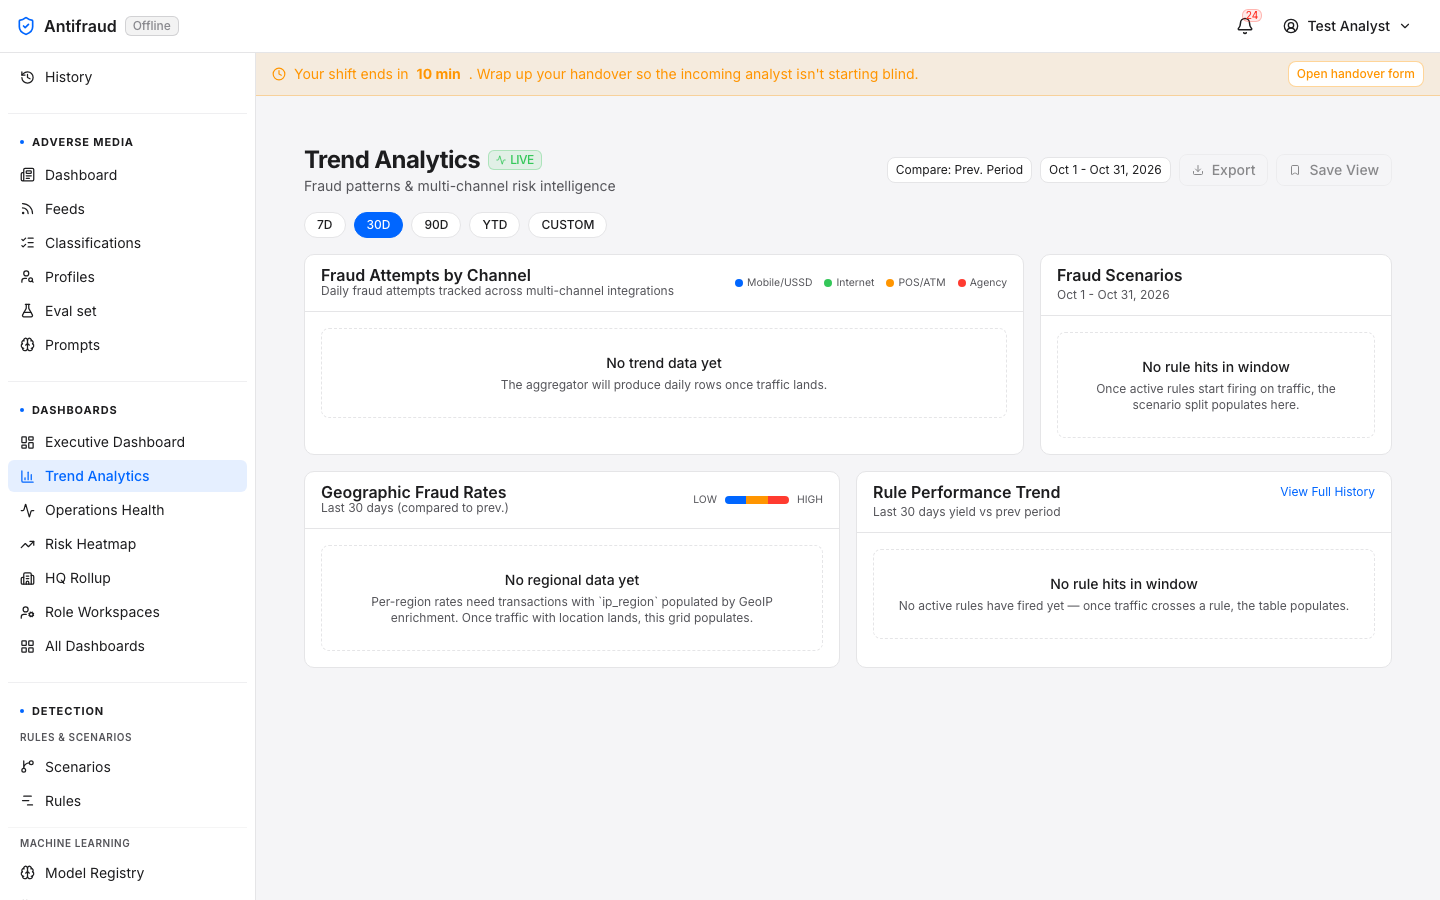
Figure 6.2 — Trend analytics. Time-series views — volumes, decline rates, scenario hit rates over windows.
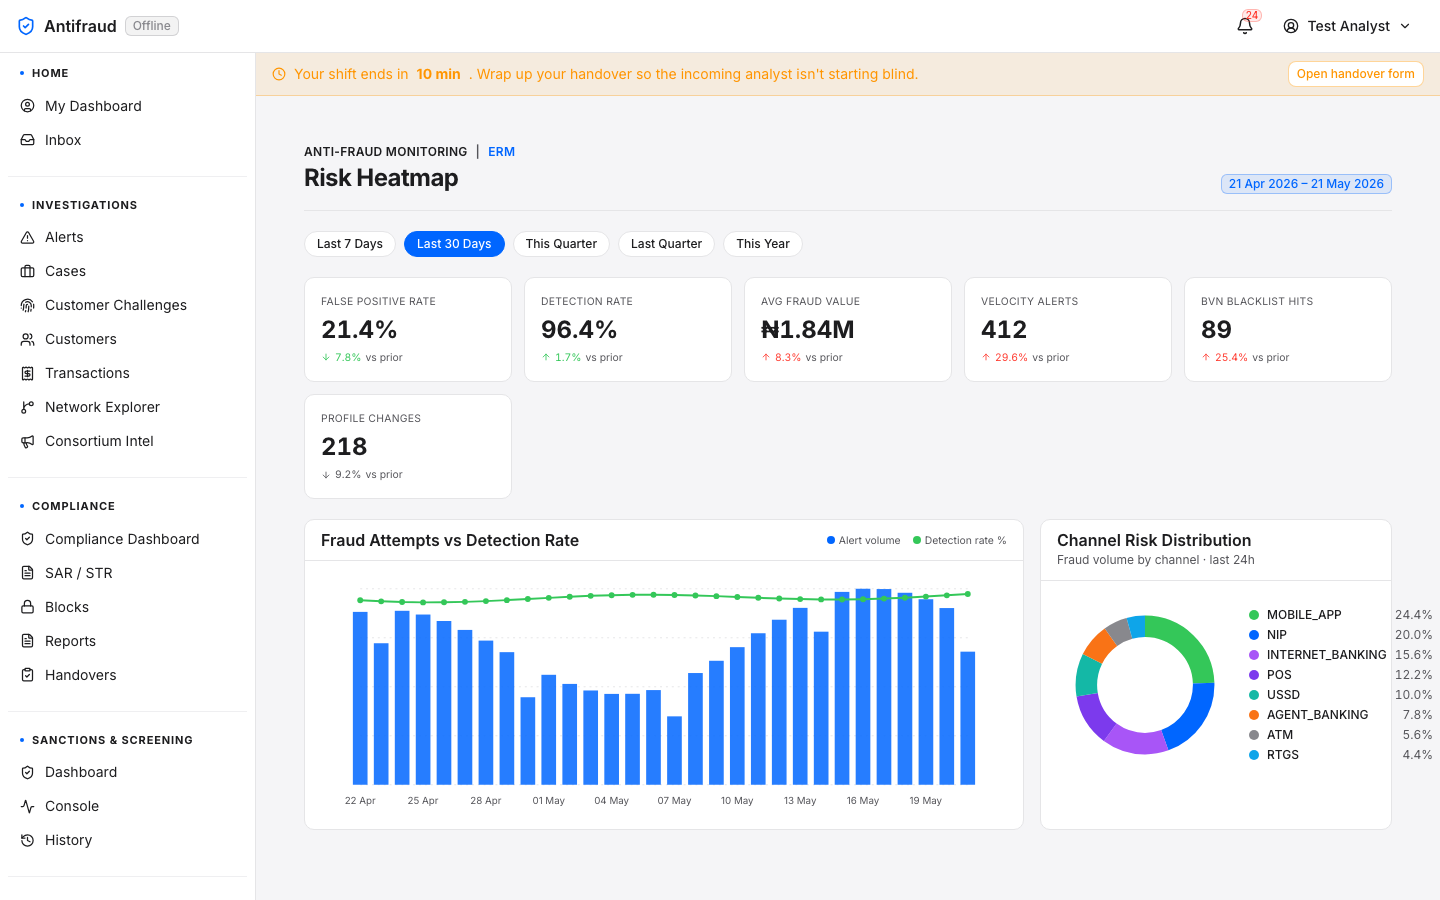
Figure 6.4 — Risk heatmap. Enterprise risk highlights — segments and scenarios coloured by exposure.
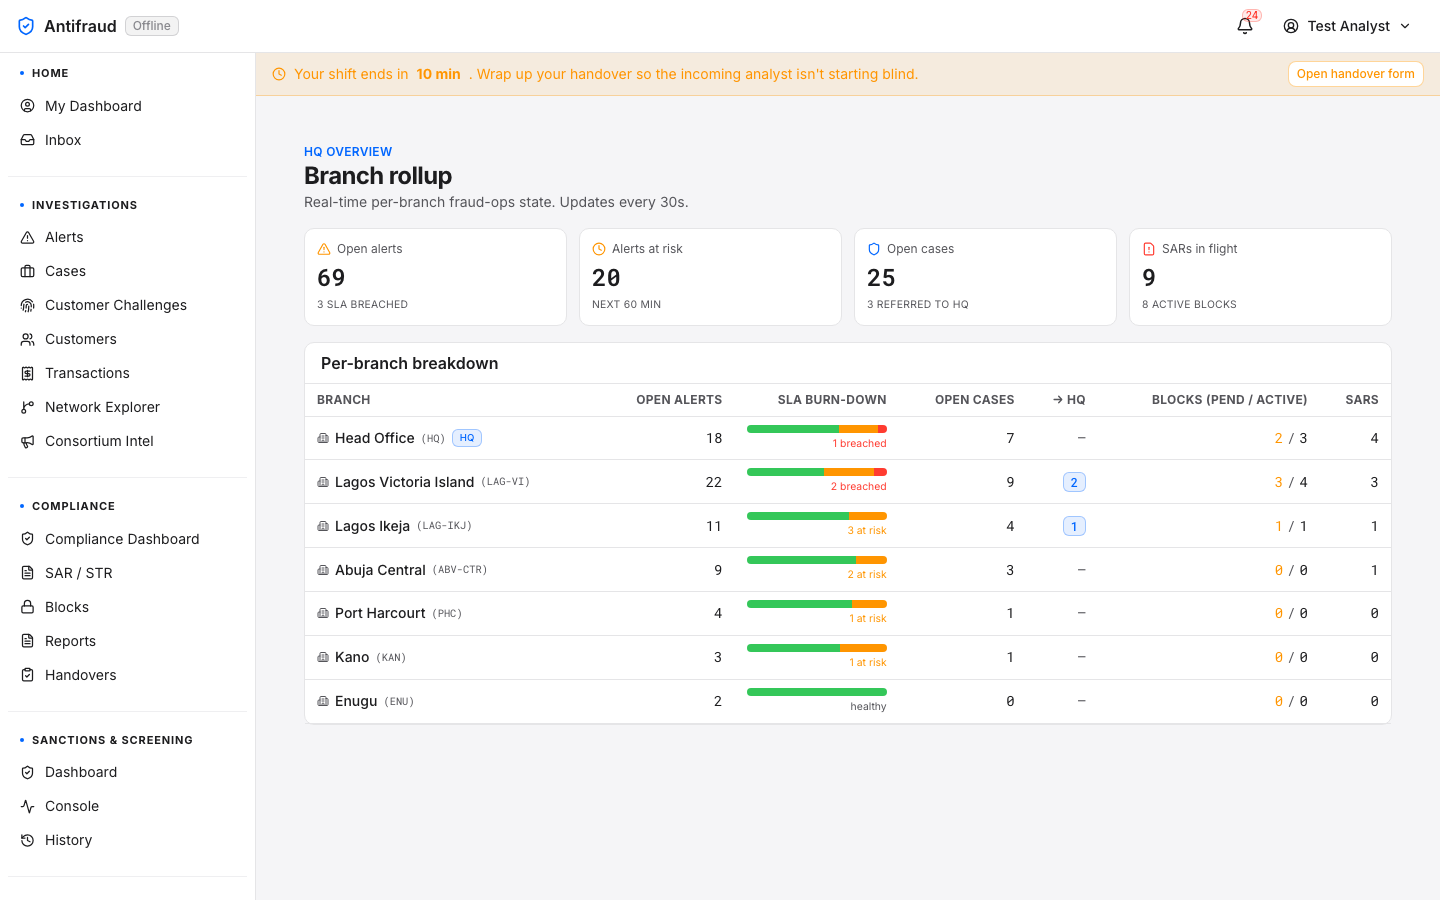
HQ rollup
Executives, head office/dashboard/hq
Figure 6.5 — HQ rollup. Branch- and LOB-level comparison view for head-office consumers.
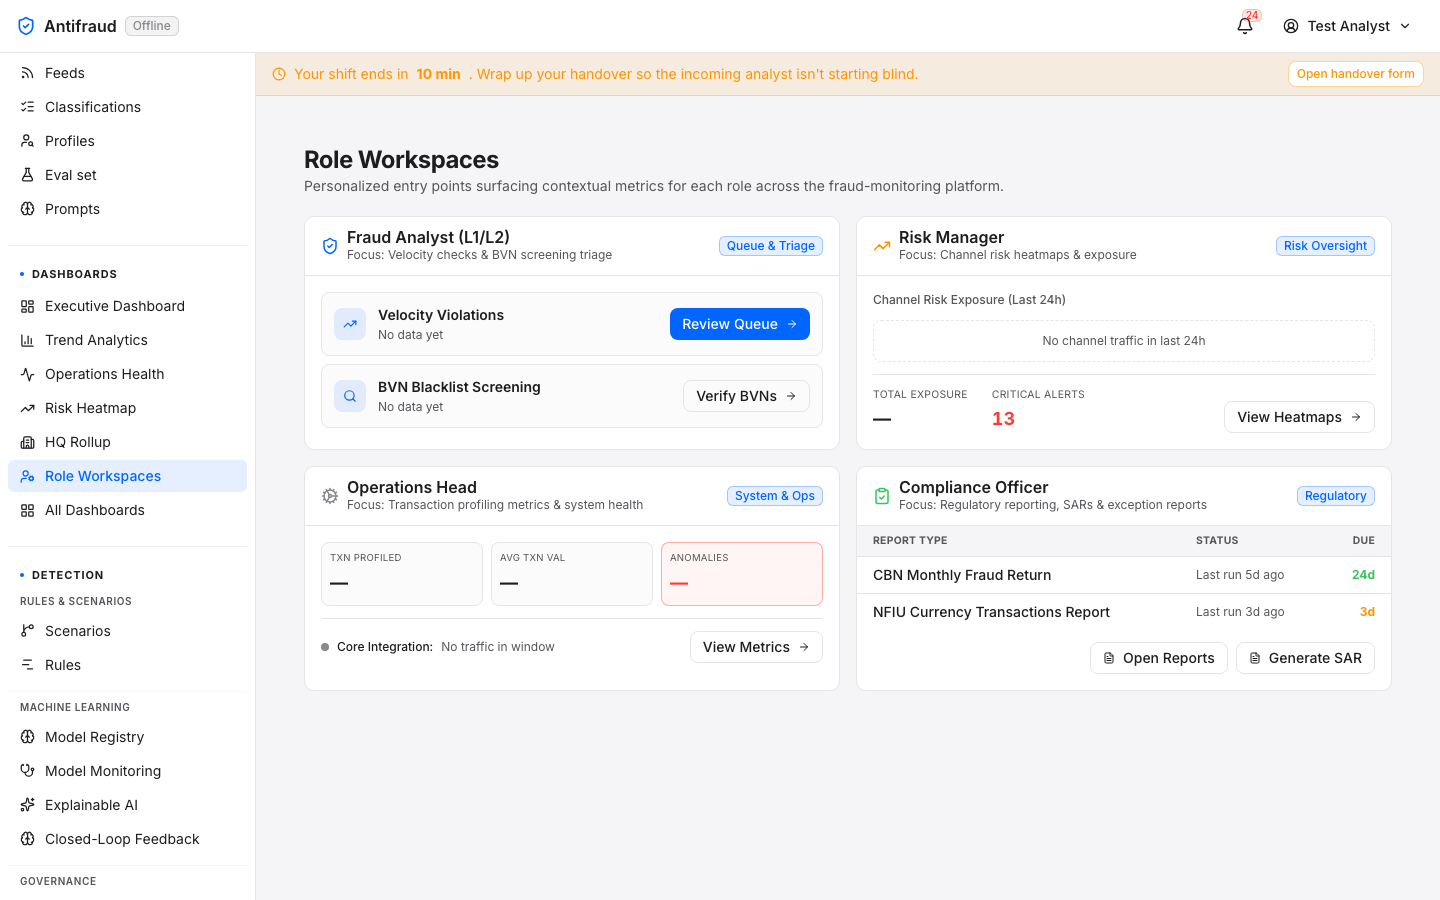
Role workspaces
All roles/role-dashboards
Figure 6.6 — Role workspaces. A library of role-tuned dashboards — analyst, team lead, compliance, exec, SRE.
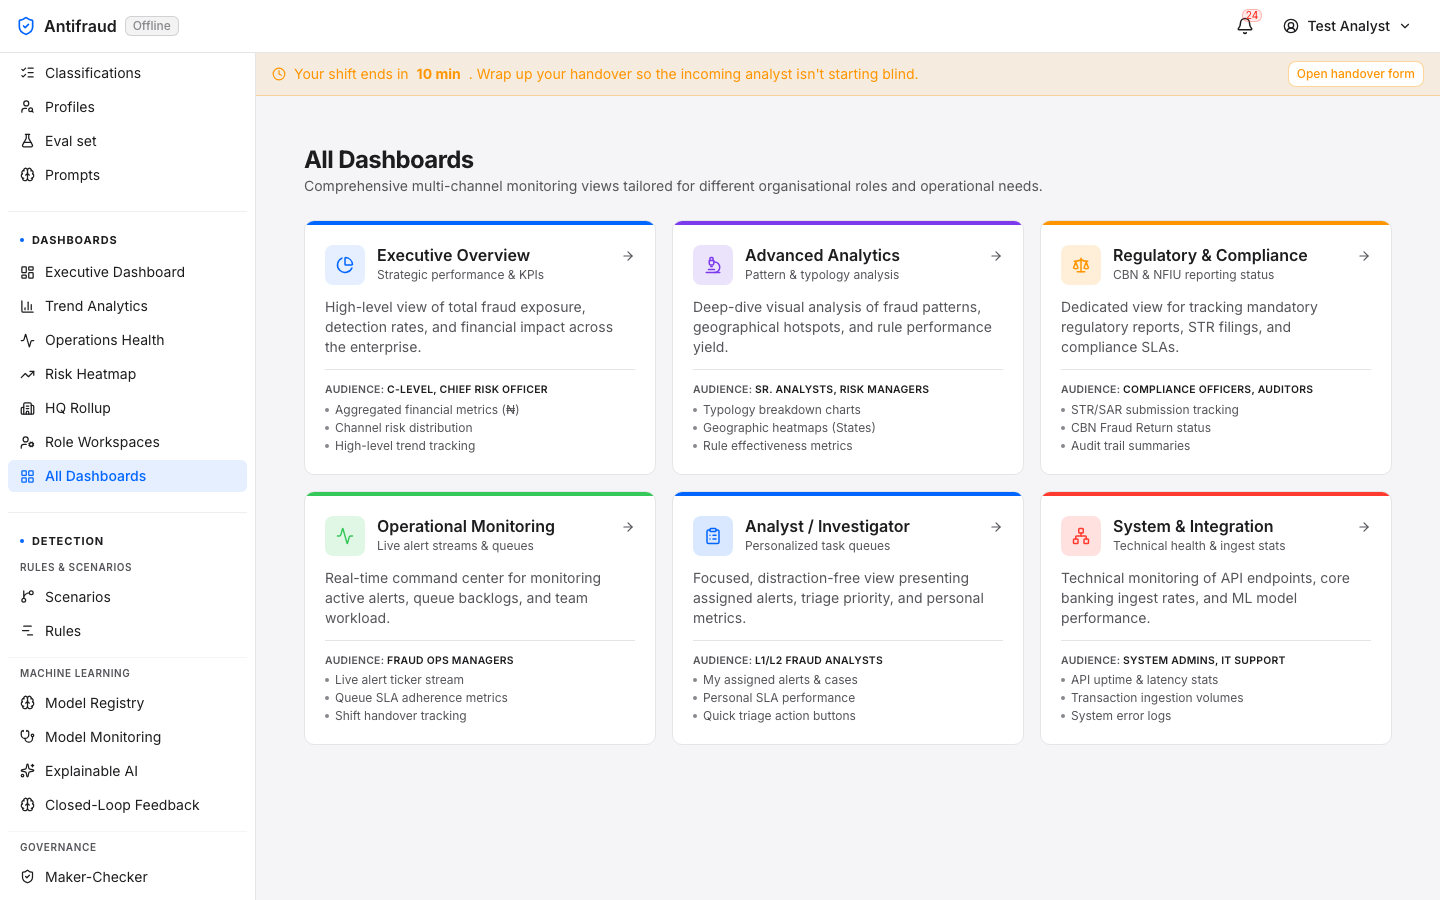
Dashboard library
Everyone/portfolio
Figure 6.7 — All dashboards. The catalogue of every dashboard the platform ships, with descriptions and audiences.
Detection & Models
Scenarios, rules and machine-learning models — the detection engine and its governance.
Detection is where the institution defines what counts as suspicious. Scenarios codify typologies; rules implement them deterministically; models score them statistically; maker-checker stops anyone from changing the engine without a second pair of eyes; fraud-to-AML promotes confirmed fraud into the AML pipeline; communications keeps the customer informed.
Scenarios
Fraud engineers/admin/scenarios
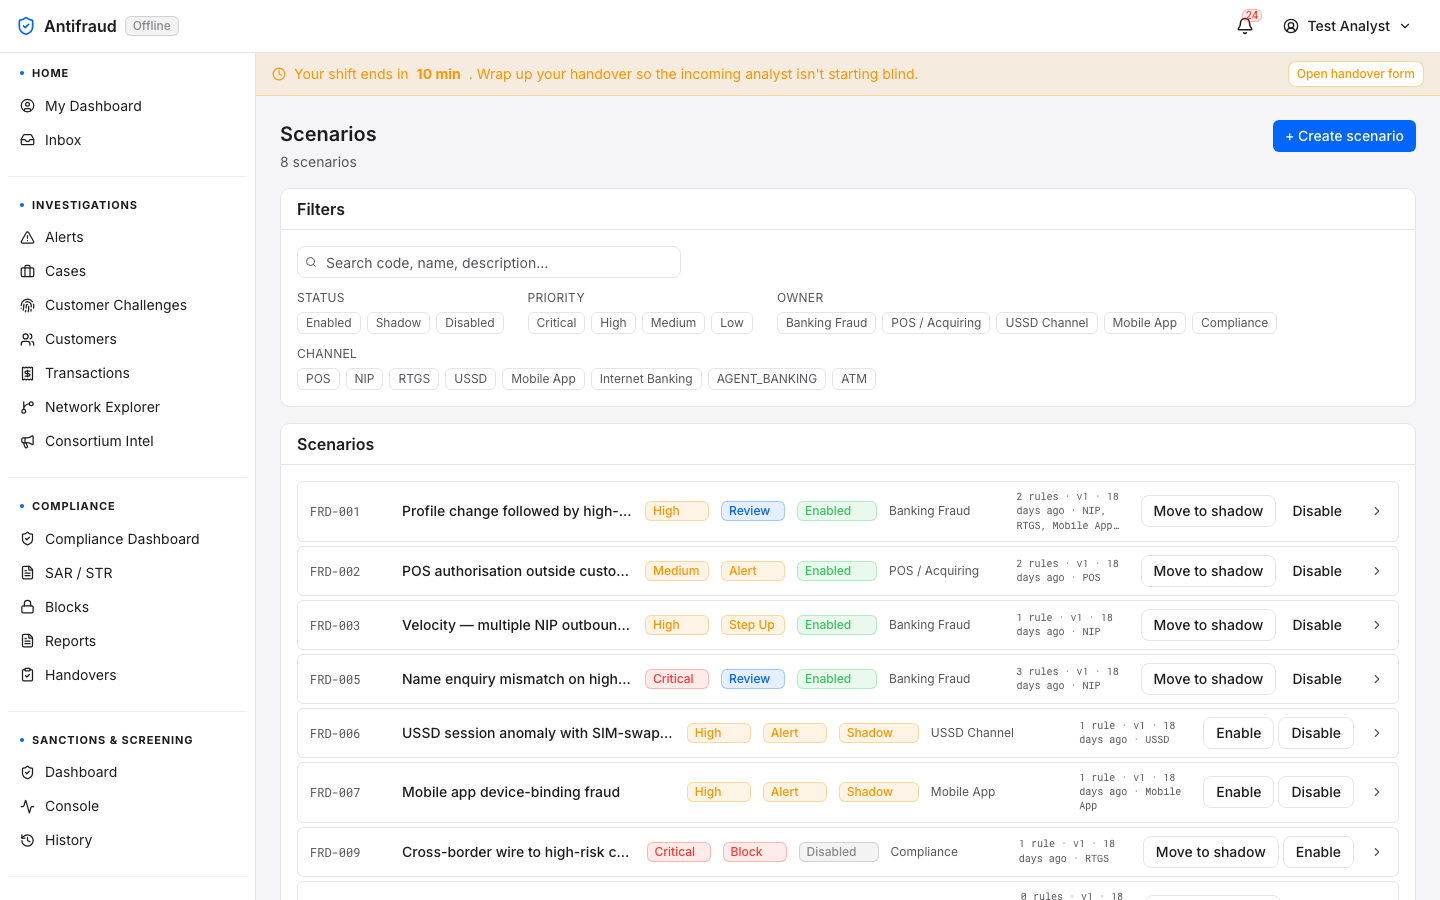
Scenarios are the institution's library of typologies — FRD-001 (profile change followed by high-value transfer), FRD-003 (NIP velocity), FRD-009 (cross-border to high-risk corridor) and so on. Each scenario binds to one or more rules and one or more models; the platform ships ten standard scenarios that cover the common Nigerian patterns out of the box.
Figure 7.1 — Scenarios. Catalogue of scenarios; click any row to inspect the rules and models bound to it.
Rules
Fraud engineers/admin/rules
Figure 7.2a — Rules list (top). Active and shadow rules, last-fire counts, owner.Figure 7.2b — Rules list (bottom). Rule-state badges and the new-rule entry point.
Why rules are versioned, not edited in place
Editing a live rule in place silently breaks every alert that fired against the previous version of the rule — the audit log loses the link between cause and effect. Kupinga therefore versions every rule. Changing logic creates a new version; the previous version is preserved and the active rule pointer is moved.
CautionRule changes are maker-checker gated. The author cannot self-approve. Promote-to-production goes through a shadow deployment for at least 24 hours by default.
Create-rule wizard
Fraud engineers/admin/rules/new5-step wizard
Purpose
Author a brand-new detection rule through a five-step guided wizard with per-step validation.
Audience
Fraud engineers (system:admin or rules:write).
When to use
When a new typology needs a rule, a new channel needs a tailored detector, or a hard-coded threshold has been validated for production.
The wizard is built so the operator cannot publish a half-finished rule — each step has its own validation gate, and Next stays disabled until the gate passes. The five steps map exactly to what the rules-service stores: basic identity, channel filter, detection logic, risk & routing, and the final back-test gate.
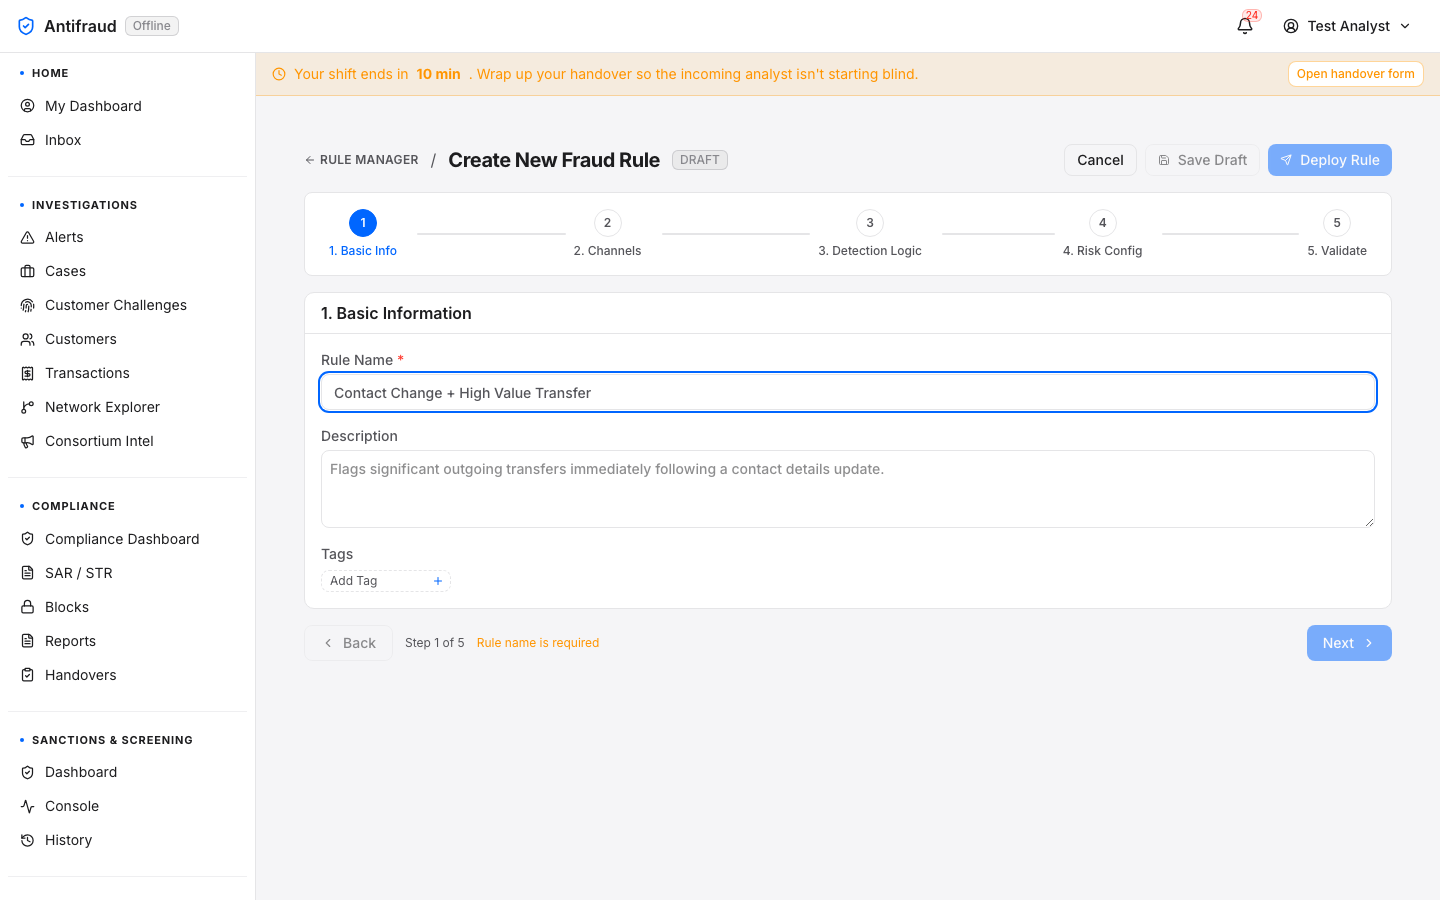
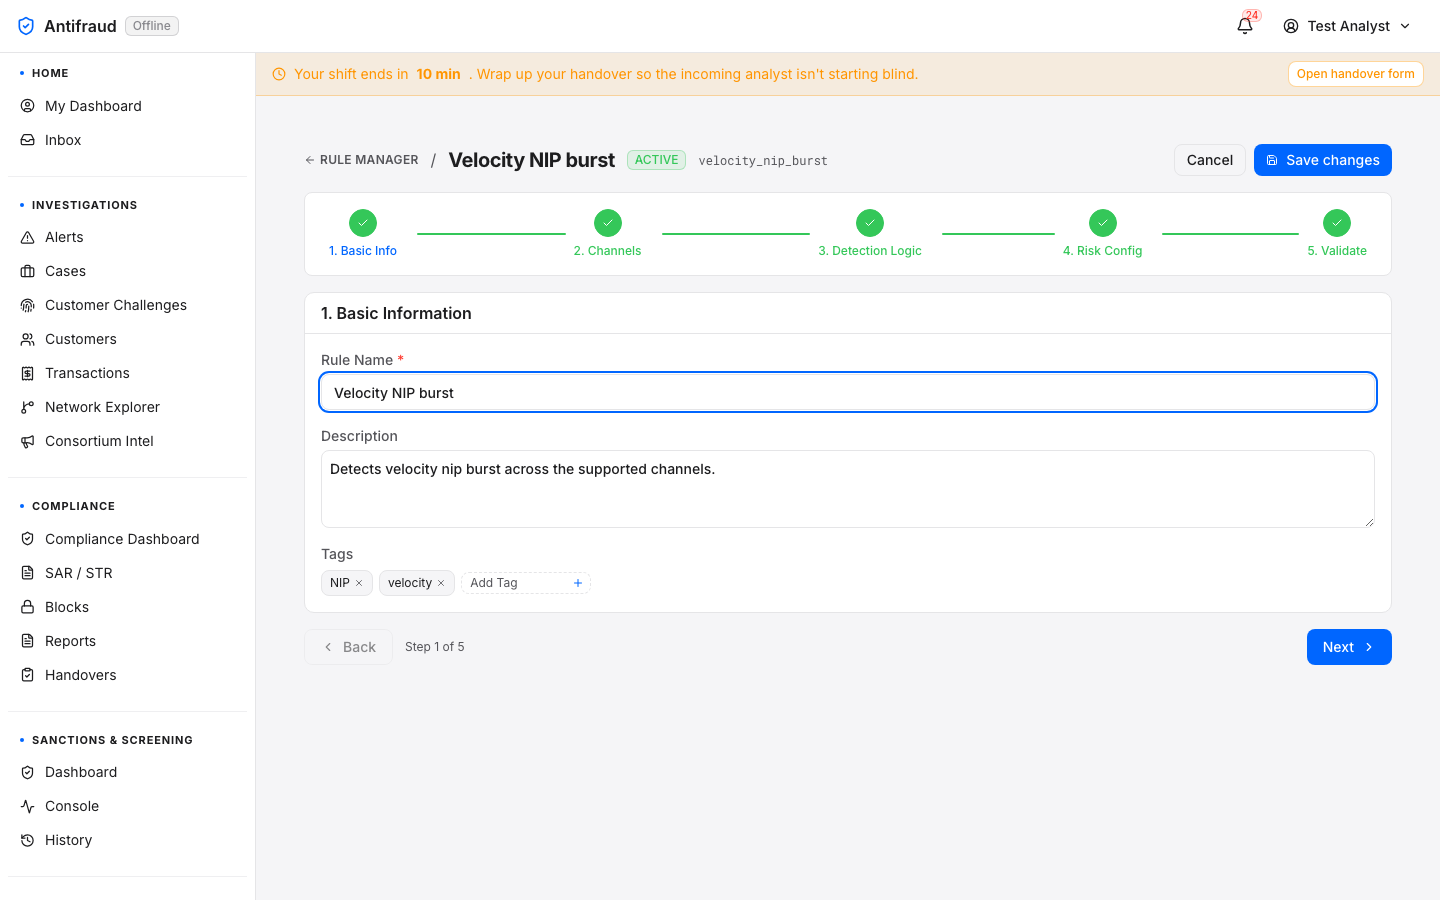
Figure 7.3 — Create-rule wizard. Guided rule-authoring flow with expression validation and back-test preview. The 5-step Stepper at the top runs through Basic Info → Channels → Detection Logic → Risk Config → Validate.
The five steps
#
Step
What it captures
Validation gate
1
Basic Info
Rule name, description, tags, category, owner team.
Rule name required.
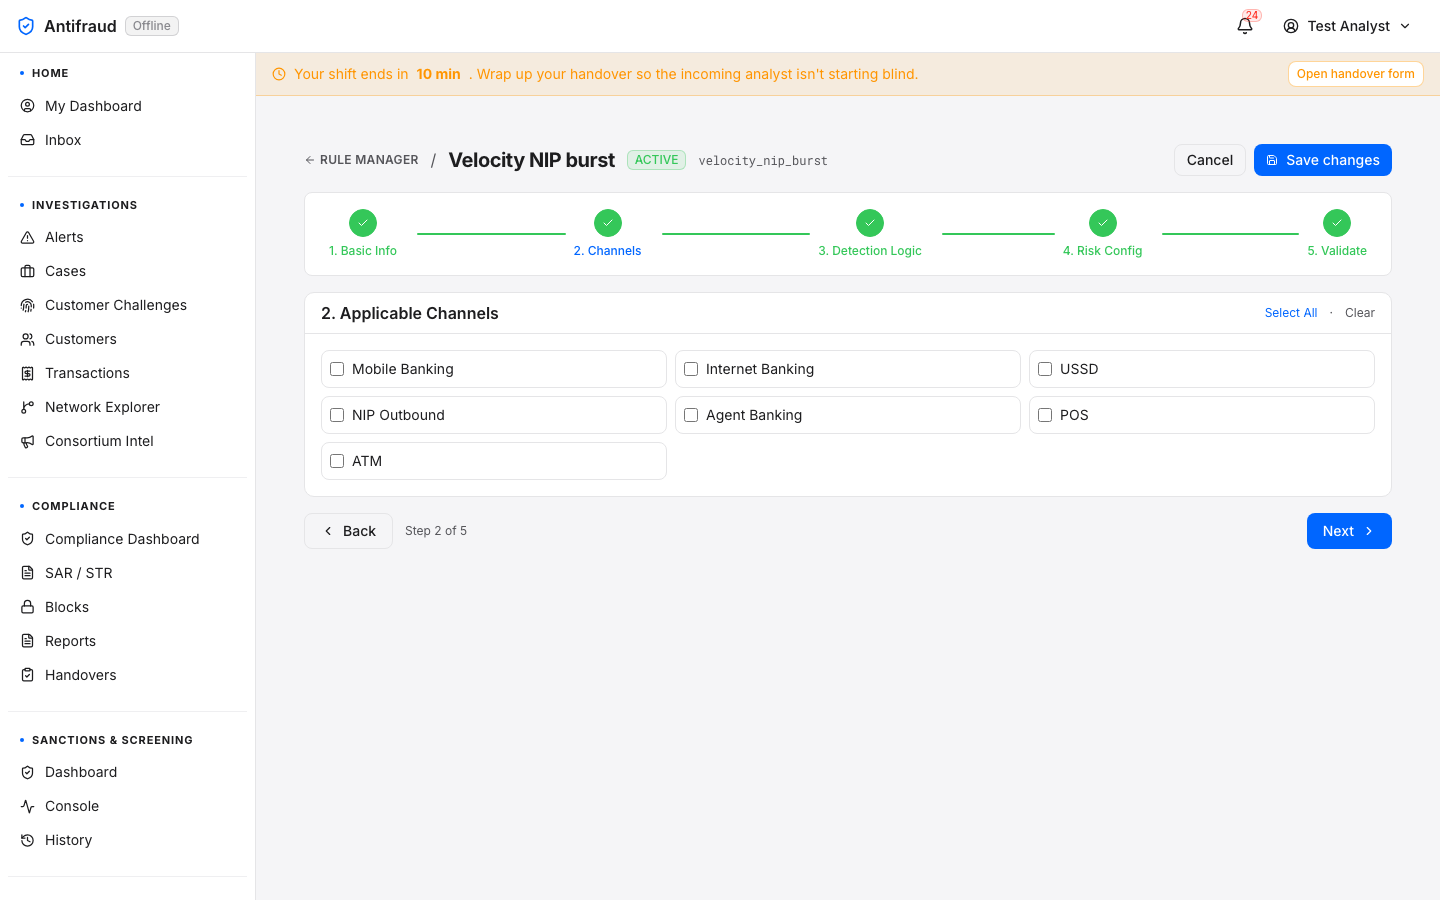
2
Channels
Which channels the rule fires on — Mobile Banking, Internet Banking, USSD, NIP Outbound, Agent Banking, POS, ATM.
At least one channel selected.
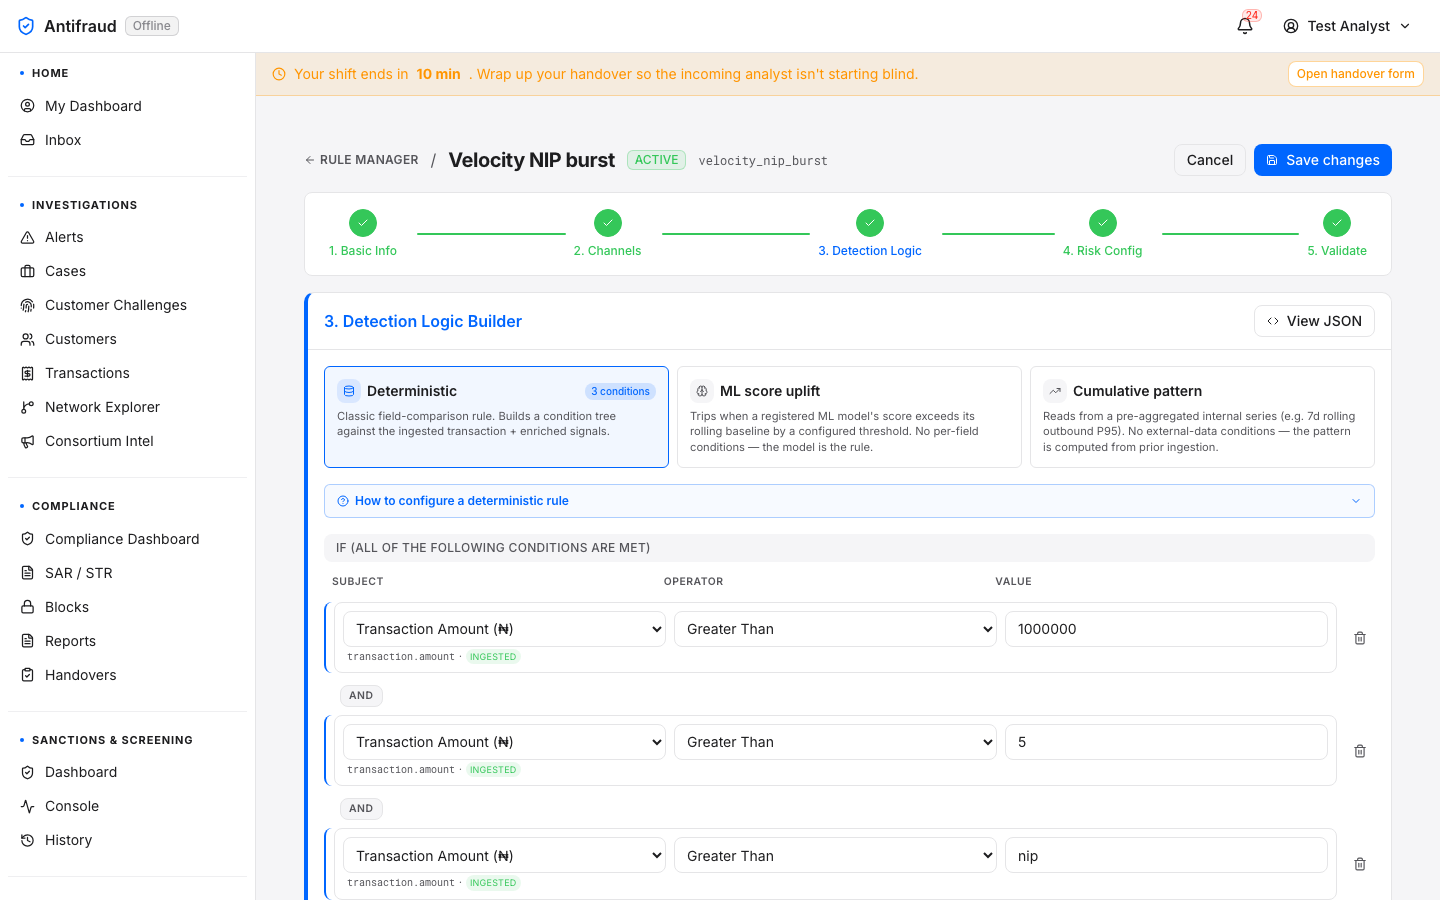
3
Detection Logic
The rule's predicate — choose between Deterministic (classic AND/OR condition tree), ML score uplift (registered model + threshold) and Cumulative pattern (pre-aggregated rolling-window series).
At least one condition (deterministic) or model/window (ml/cumulative).
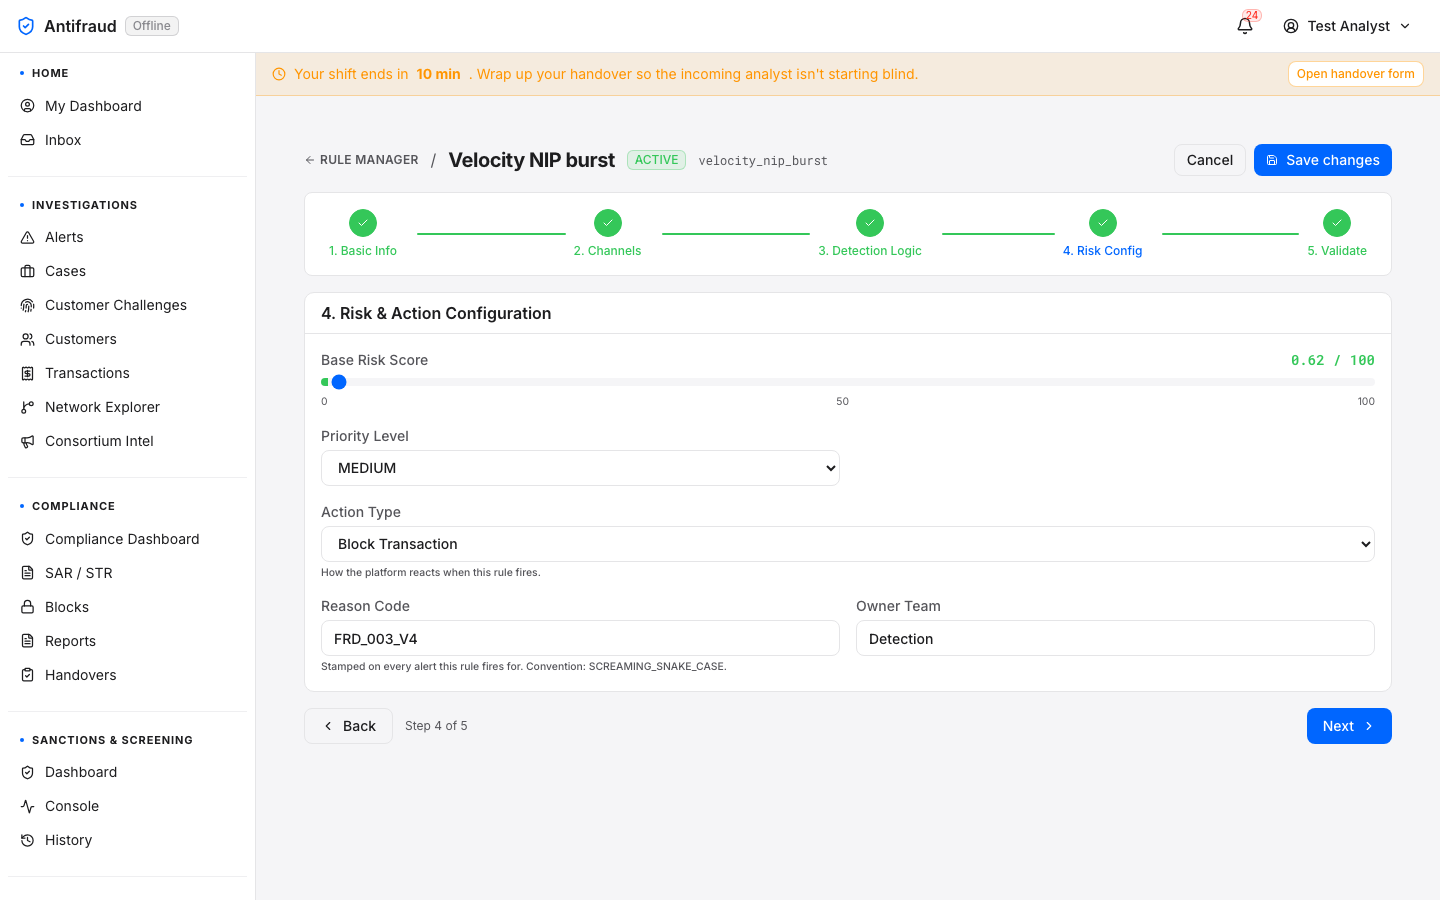
4
Risk Config
Base risk score (0–100), priority level (Low / Medium / High / Critical), action type (Score only / Step-up challenge / Block transaction / Open case), reason code, owner team.
Base score > 0 and action type chosen.
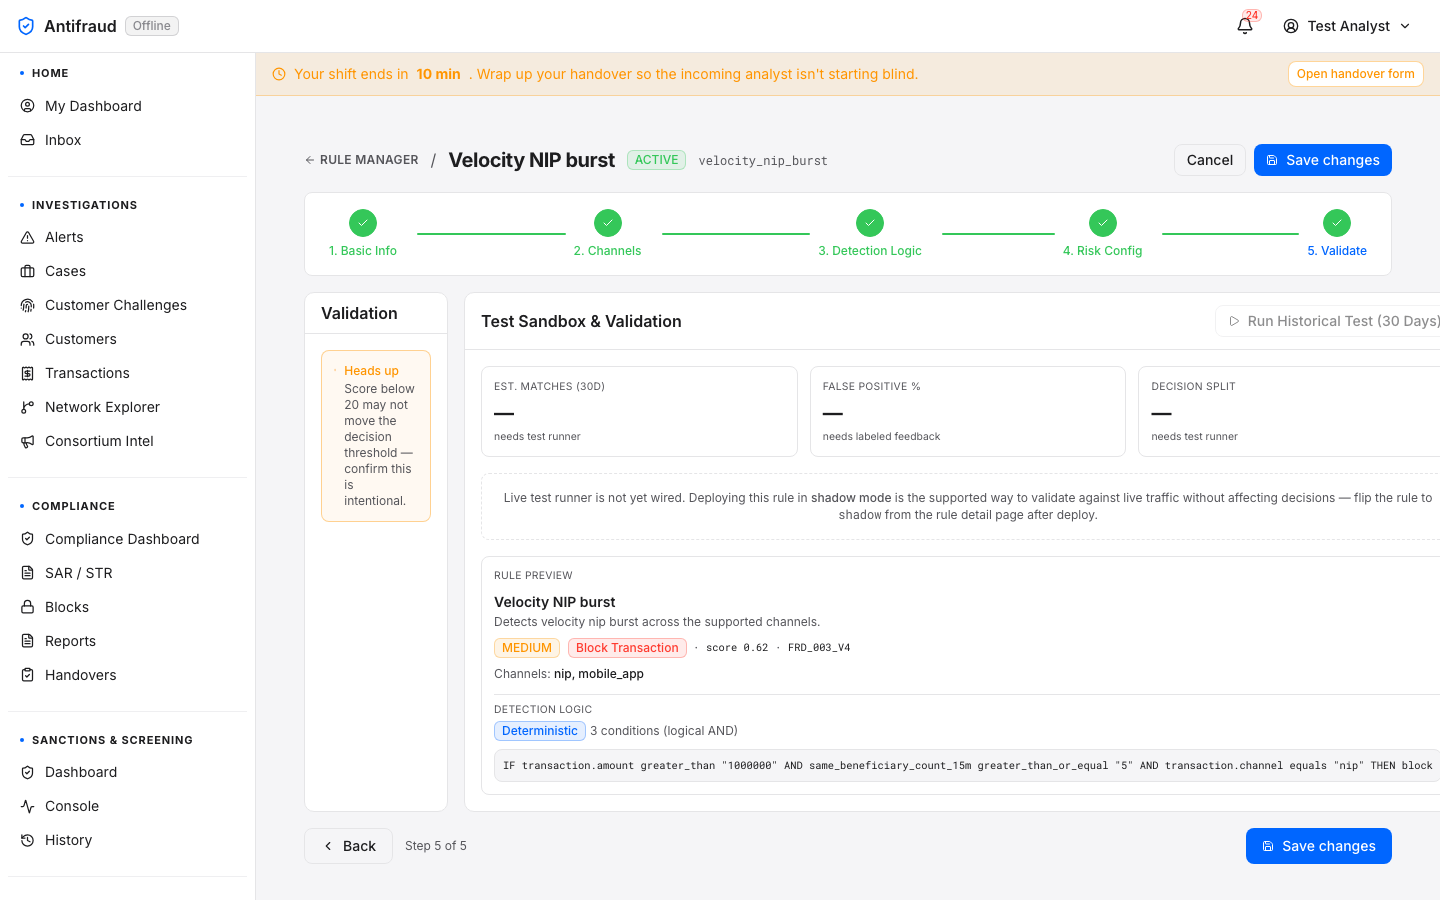
5
Validate
Final preview + Test Sandbox. Shows estimated 30-day matches, false-positive %, decision-split projection, and the complete DSL the wizard will publish.
Server-side compile of the DSL must succeed.
How to use
Name and describe the rule on Step 1. Tag it with the scenario family (FRD-001, FRD-003 …) so the rule library stays searchable.
Pick the channels on Step 2. Channels not selected here are exempt from the rule even if their transactions match the predicate.
Build the predicate on Step 3. Use the inline "How to configure a deterministic rule" disclosure for the field catalogue.
Set the score, priority, action and reason code on Step 4. The reason code is stamped on every alert the rule fires.
On Step 5, run the Historical Test (30 days) and read the projected match volume. If the projection is wildly higher than expected, walk Step 3 back and tighten the predicate.
Submit. The rule lands in maker-checker pending approval — a second engineer reviews and promotes.
CautionNew rules deploy in shadow by default. They evaluate but do not affect decisions until promoted to active. Plan for at least 24h of shadow observation before flipping a high-impact rule live — see Manage existing rule for the promotion path.
Find, inspect and version-edit any rule already in the catalogue. Editing reuses the 5-step wizard so the engineer changes the rule through the same validation gates as the original author.
Audience
Fraud engineers; team leads who promote shadow rules to active.
When to use
Tightening a threshold; adding a channel; pausing a rule that is producing noise; promoting a shadow rule to production; reviewing a rule's version history before a regulator visit.
Rules are versioned, not edited in place. Every save publishes a new rule_versions row; the previous version is preserved and the rule's current_version_id pointer is moved atomically. Every alert produced by a rule remembers exactly which version fired it, so the audit trail never loses the cause-and-effect link.
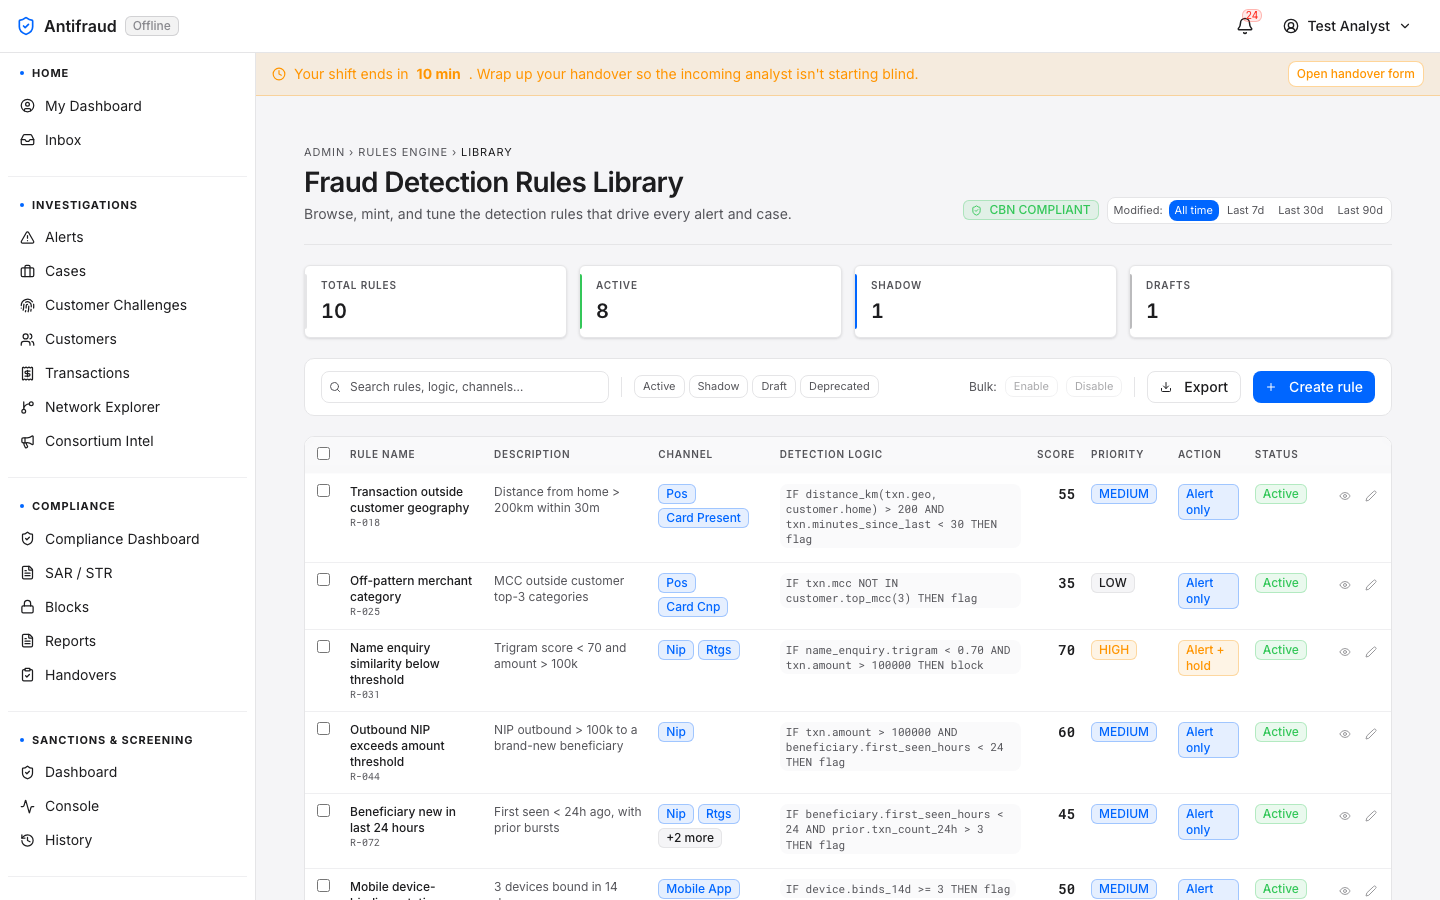
Entry — the Rules Library
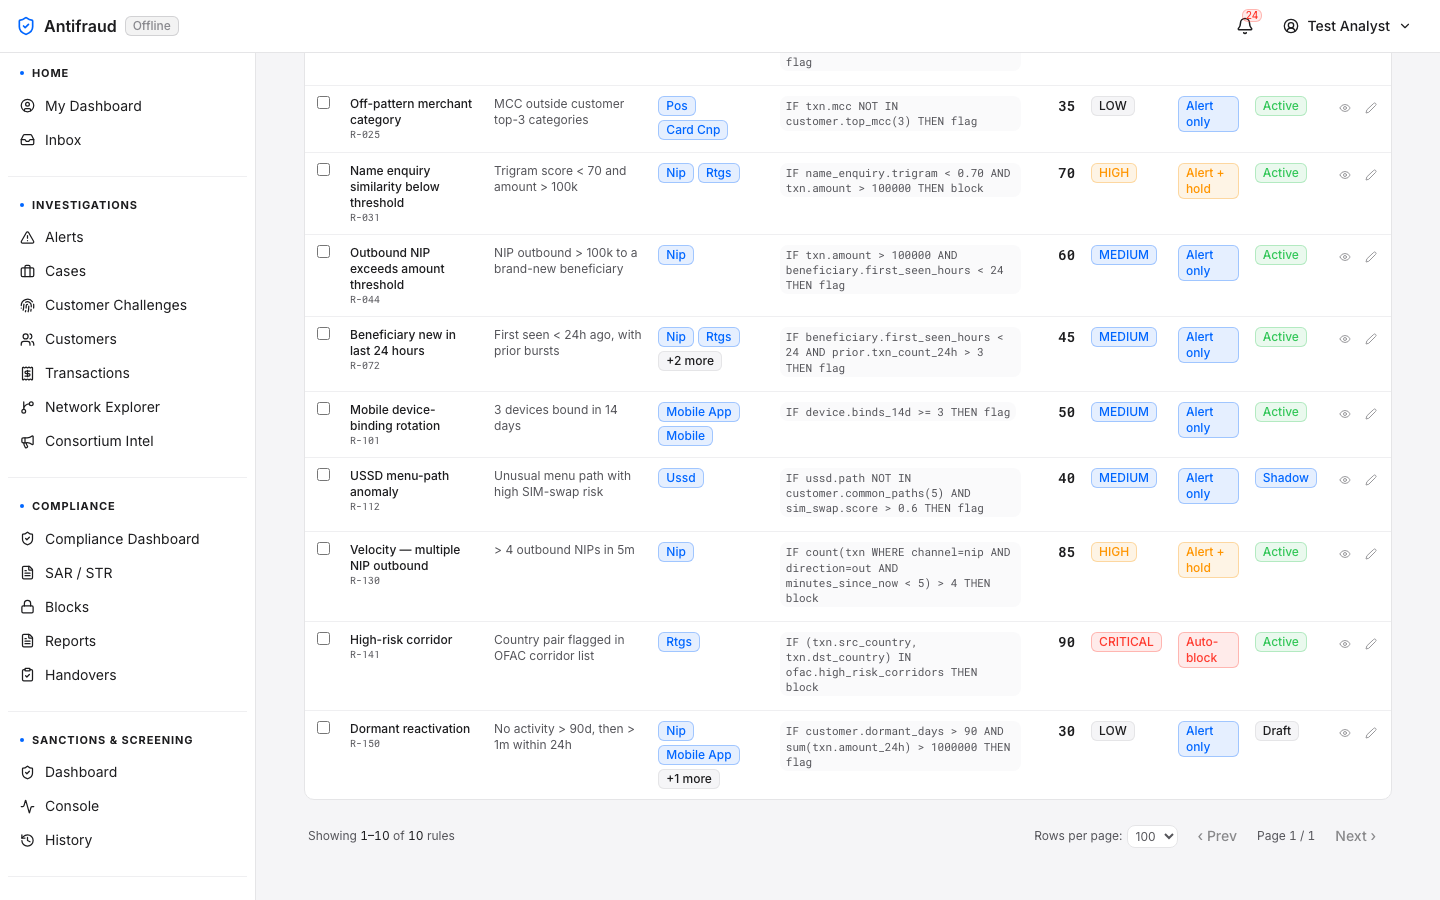
Figure 7.3.1 — Fraud Detection Rules Library (entry). KPI strip at the top (Total Rules 10, Active 8, Shadow 1, Drafts 1) plus toggles (10/100% compliant, Newest, Last 7d, Last 24h). The catalogue table lists every rule with code, name, channels, detection logic preview, score, priority, status, in-use count and last-updated. Each row carries Preview (eye) and Edit (pencil) affordances; the blue Create rule button top-right launches the new-rule wizard. Rules is the active tab in the Detection module submenu, with Detection highlighted in the left sidebar.
The edit flow — same 5-step wizard, populated
Clicking the Edit affordance on any rule opens /admin/rules/<id>. The page reuses the Stepper from the create wizard, but every step is pre-populated from the rule's current version, and every step in the Stepper is marked complete so the engineer can jump directly to any step they need to change.
Figure 7.3.2 — Step 1 Basic Info (editing "Velocity NIP burst"). Sticky header carries RULE MANAGER / Velocity NIP burst, the green ACTIVE status badge, the snake-case rule identifier velocity_nip_burst, plus Cancel and Save changes affordances. An amber "Heads up" banner warns when a rule was authored before migration 0142 and its DSL is not in the wizard's grammar — Step 3 will open empty in that case. The Stepper shows all five steps green-checked. Step 1 form is populated: Rule Name "Velocity NIP burst", Description, Tags (NIP, velocity).Figure 7.3.3 — Step 2 Applicable Channels. Eight channel checkboxes (Mobile Banking, Internet Banking, USSD, NIP Outbound, Agent Banking, POS, ATM) with Select All / Clear affordances. The rule's existing channel selection is restored from the persisted state.Figure 7.3.4 — Step 3 Detection Logic Builder. Kind picker across the top (Deterministic selected · 3 conditions; ML score uplift; Cumulative pattern) with one-liner explanations. "How to configure a deterministic rule" disclosure. Below the AND/OR header, three condition rows show transaction.amount > 1000000, same_beneficiary_count_15m > 5, transaction.channel = nip, each with its INGESTED-field badge. The View JSON action top-right reveals the persisted wizard payload.Figure 7.3.5 — Step 4 Risk & Action Configuration. Base Risk Score slider (currently 0.62 / 100) with 0 / 50 / 100 ticks; Priority Level dropdown set to MEDIUM; Action Type dropdown set to Block Transaction; Reason Code FRD_003_V4 (SCREAMING_SNAKE_CASE convention, stamped on every alert the rule fires); Owner Team Detection.Figure 7.3.6 — Step 5 Test Sandbox & Validation. Left-rail "Heads up" note: "Score below 20 may not move the decision threshold — confirm this is intentional." Three preview tiles — EST. MATCHES (30D), FALSE POSITIVE %, DECISION SPLIT — each labelled "needs test runner" / "needs labeled feedback" because the historical-test runner hasn't been wired in this environment yet. The Run Historical Test (30 Days) action sits top-right. Below: the Rule Preview card with the rule's display name, description, status pills (MEDIUM · Block Transaction · score 0.62 · FRD_003_V4), the channels list (nip, mobile_app), and the full Detection Logic IF-clause expanded literally so the operator can read what will publish. Save changes is enabled when validation passes.
Common workflows
Workflow
Steps
Notes
Tighten a threshold
Edit → Step 3 → adjust condition value → Step 5 → Save changes.
Publishes a new version; previous version preserved. Maker-checker required for production rules.
Triggers a fresh shadow window for the new channel unless the rule is explicitly promoted in the same save.
Promote shadow → active
From the rule preview or detail page, click Promote to active; a team-lead approver confirms.
The original author cannot promote their own rule (separation of duties).
Pause a noisy rule
Edit → Step 1 (or the rule detail action menu) → toggle status to paused → Save.
Pauses immediately; no maker-checker required for pause/resume on the operator's own rule.
Roll back to a prior version
Rule detail → Version History tab → click the older version → Promote this version.
Atomic switch of current_version_id. No data loss — the rolled-back version becomes the new head.
Retire a rule permanently
Edit → Step 1 → status disabled → Save. Then archive from the catalogue.
Archived rules disappear from the active library but remain queryable for audit.
Versioning & audit
Every save publishes a new rule_versions row with change_notes, reason_code and wizard_payload snapshot. The wizard payload makes future edits round-trip cleanly — the structured condition tree is restored verbatim, bypassing the lossy DSL parser.
Every promotion is recorded in the Audit log as rule.version_promoted, with the actor's email and the from/to version numbers.
Every rule remembers which alerts it produced and at which version, so the alert detail page can always answer "which exact logic fired this?".
CriticalChanging a production rule is maker-checker gated. The engineer who saves the change cannot self-approve it. Bypassing maker-checker on a live rule is impossible from the UI; the API permits it only with a break-glass role that itself triggers an audit ticket and a compliance escalation.
TipIf you only need to read the current rule logic (not change it), use the Preview (eye) affordance on the catalogue row instead of Edit. Preview reads the same data without taking the rule into the wizard, so a stray Save changes click cannot accidentally publish a new version.
Model registry
ML engineers, risk team/ml
Every model that has ever been registered with the platform — production, shadow, candidate, retired — with the version, training metadata, AUC, drift status and the operator who promoted it.
Figure 7.4 — Model registry. Models with version, state and key performance metrics.
Model monitoring
ML engineers/ml/monitoring
Figure 7.5 — Model monitoring. Drift, calibration and segment-level performance over time.
CautionIf drift exceeds the configured threshold for more than one day, the platform raises a system-level alert and de-prioritises the model's contribution to scoring until it is retrained or rolled back.
Explainable AI
Compliance, ML engineers/ml/governance
Per-decision feature attribution. The regulator-facing view that proves any individual decision can be explained.
Figure 7.6 — Explainable AI. Feature attribution and reason codes for sample decisions.
Closed-loop feedback
ML engineers/admin/ml
The store of analyst decisions that feed the next training cycle. Every approve/decline lands here with the analyst's identity, the timestamp, the rationale and the underlying features.
Figure 7.7 — Closed-loop feedback. Recent analyst feedback events and aggregate quality metrics by analyst and by model.
Maker-checker
Administrators/admin/maker-checker
The central record of every change that needed a second approver — rule edits, scenario toggles, model promotions, integration changes, role grants and more. Pending items appear at the top of the page for the relevant approvers.
Figure 7.8 — Maker-checker. Pending approvals with subject, change type, requester and SLA, plus the history strip of approved, rejected and expired items.
CriticalThe platform refuses to let any user approve their own change, regardless of role. This is hard-coded; no role tier can bypass it.
Fraud → AML
Administrators/admin/fraud-to-aml
The bridge between confirmed fraud and the AML pipeline. Configures which case outcomes promote into AML monitoring and how the AML team is notified.
Figure 7.9 — Fraud → AML. Promotion rules — which fraud outcomes feed the AML pipeline.
Communications
Administrators/admin/communications
Outbound customer communication templates and the workflows that send them — block notifications, SAR-related outreach, challenge messages. Each template has a localised version per supported language and a per-channel variant (SMS, email, in-app).
Figure 7.10 — Communications. Workflows for outbound customer notifications.
Administration
Access, role tiers, institutional configuration, third-party integrations.
Administration is the configuration surface — it answers the questions "who can use the platform", "what is the institution's policy", "how do third parties plug in" and "what runs on a schedule". Most users will not touch this section; system administrators live in it.
Users & RBAC
System administrators/admin/users
The user directory — every account, the role tier it belongs to, its status (active, locked, disabled), its last sign-in and its branch/team membership. Administrators provision new users here, unlock accounts after lockouts, and disable users who leave the institution.
Figure 8.1 — Users & RBAC. Every user account with role, status, branch and last sign-in.
Common procedures
Provision a new user. Click New user, enter their work email, choose role tier, branch and team, save. The platform emails the user an activation link.
Unlock an account. Find the user, click Unlock. The unlock is recorded in the audit log.
Disable a user. Disabled users cannot sign in; existing sessions are revoked immediately.
Grant elevated access. Use Access requests to grant temporary just-in-time permissions; do not assign permissions ad hoc.
CautionEditing a user's role tier is maker-checker gated. The administrator who edits the role cannot self-approve the change.
Role tiers
System administrators/admin/roles
Role tiers are bundles of permissions — Junior Analyst, Senior Analyst, Team Lead, Compliance Officer, Compliance Reviewer, Compliance Approver, Risk Officer, Fraud Engineer, System Administrator, Platform SRE. Each tier maps to a fixed permission set; institutions can clone a tier and adjust the permissions for their own policy.
Figure 8.2 — Role tiers. Tier definitions with the permissions each tier grants.
NoteSome permissions can only be granted via a role tier — never inline on a user. This is enforced to prevent ad-hoc administrative grants that go unaudited.
Branches
System administrators/admin/branches
Figure 8.3 — Branches. The institution's branch directory; users and queues bind to branches for routing.
Teams
System administrators/admin/teams
Figure 8.4 — Teams. Teams as the routing primitive — alerts and cases route to teams; users belong to one or more.
Access requests
Approvers (access:grant or admin)/access-requests
Just-in-time access. A user requests an elevated permission with a reason, an approver reviews it, and the grant is time-bound — it expires automatically when the window closes. Used for break-glass scenarios, after-hours support, and tightly-scoped audit access.
Figure 8.5 — Access requests inbox. Pending requests for the approver; click any to review the rationale and decide.
TipPrefer JIT access over permanent role-tier changes for anything that is one-off. The audit log makes JIT easy to defend; permanent grants accumulate and become a security debt.
My access requests
All signed-in users/access-requests/mine
Figure 8.6 — My access requests. Your own outstanding and historical JIT requests.
SLA policy
System administrators/admin/sla
The institution's service-level policy — how long an alert at each priority is allowed to wait, when a case is overdue, when a block must be reviewed. Every SLA band in the platform reads from here.
Figure 8.7 — SLA policy. SLA budgets by priority and queue. Editing this changes the SLA banding everywhere in the platform.
CautionLoosening an SLA hides risk rather than reduces it. Discuss the change with risk and compliance before applying.
Bank configuration
System administrators/admin/bank-configuration
Identity of the institution — display name, CBN code, branding, default currency, default timezone, supported channels. Tenants in a multi-bank deployment have one bank-configuration record each.
Figure 8.8 — Bank configuration. Institution identity, branding and channel posture.
Scheduled jobs
System administrators/admin/jobs
Figure 8.9 — Scheduled jobs. Every cron-driven job — refreshes, sweeps, reconciliations and report runs.
Customer challenges
Administrators/admin/challenges
Step-up records — OTP, callback and video proof-of-life challenges issued to customers. Used by analysts to confirm a transaction is genuine before approving a high-risk decision.
Figure 8.10 — Customer challenges. Per-customer challenge attempts with outcome and rationale.
Programmatic credentials. Every integration that calls the platform's API does so with a scoped API key — never with a user's session token. Keys are rotated on a schedule and revoked the moment an integration stops being used.
Figure 8.12 — API keys. Key inventory with scope, owner, last-used timestamp and rotation status.
CriticalThe secret value of an API key is shown only once — at issuance. There is no recovery path. If you lose the secret, rotate the key.
Integrations registry
System administrators/admin/integrations
The single place where every third-party system the platform talks to is registered — sanctions lists, KYC providers, NIBSS, OFAC, NIMC, GDelt, MaxMind, Apicurio Schema Registry, MinIO, comms providers and more. New integrations are added here so the platform always has one place that answers "what are we depending on".
Figure 8.13 — Integrations registry. Every external dependency with category, status, owner and last health check.
The Enterprise Databus is how customer data enters the platform. Each tenant bank has one or more adapters that pull events from its core systems, mappings that translate proprietary formats into the canonical schema, and reconciliation runs that prove the platform agrees with the source of record. The Banking Simulator is the sandbox-only counterpart used to rehearse onboarding without touching production data.
Tenant onboarding wizard
Databus administrators/admin/databus/onboard
The guided onboarding flow — picks a template, creates the tenant, attaches an adapter, generates a mapping, and validates against a sample payload, in one pass.
Figure 9.1a — Onboard wizard (top). Choose a template and start a new tenant.Figure 9.1b — Onboard wizard (middle). Adapter and mapping configuration.Figure 9.1c — Onboard wizard (bottom). Validation against a sample payload before activation.
Figure 9.3 — Tenants & adapters. Adapters grouped by tenant with state, last event, and lag.
Mapping editor
Databus operators/admin/databus/mappings
Per-tenant field mapping from the source-of-record format into the canonical schema. The editor renders the source payload on the left and the canonical schema on the right; the operator draws lines between fields.
Figure 9.4 — Mapping editor. Two-pane field mapping with sample preview, transformation expressions and validation diagnostics.
Schema registry
Databus operators/admin/databus/schemas
Figure 9.5 — Schema registry. Canonical schemas with version lineage and per-tenant compatibility status.
Dead-letter queue
SRE, databus operators/admin/databus/dlq
Events that failed to parse, validate or process land in the dead-letter queue with the failure reason. Operators inspect, fix the upstream cause, and replay individual events or batches.
Figure 9.6 — Dead-letter queue. Failed events with reason, tenant, source topic and replay options.
CautionReplaying a DLQ event re-injects it at the head of the pipeline. If the same root cause is still in place, the event will be DLQ'd again — fix the upstream issue before replaying in bulk.
Reconciliation
SRE/admin/databus/recon
Figure 9.7 — Reconciliation runs. Daily reconciliation between Kupinga and the tenant's source of record.
Lineage explorer
SRE, compliance/admin/databus/lineage
For a chosen event, the platform shows where it came from, every transformation it underwent, every decision it informed and every downstream artifact (alert, case, SAR, block) it produced. The auditor's chain of custody.
Figure 9.8 — Lineage explorer. Search by event ID; the graph shows source, transformations and downstream artifacts.
Databus settings
Databus administrators/admin/databus/settings
Figure 9.9 — Databus settings (admin view). Title Databus settings with subtitle "Runtime-configurable knobs for the databus + streaming fabric. Env-var overrides take precedence; sensitive values are written to Vault and tracked by reference." The blue Single-tenant scope chip top-right is selected; the inline banner explains "Single-tenant mode. Every setting on this page is the deployment-wide global. The per-tenant override picker is hidden because the deployment is the tenant boundary. To edit per-tenant overrides you would first enable platform.multi_tenant_enabled on the feature flags page." The settings list below renders one row per knob with the key as a monospace token, the type (bool · int · duration · string · vault_ref), the source (global · env · tenant · default), the editable value field, and a per-row description: platform.multi_tenant_enabled (bool · global · true), ingest.parser.batch_size (int · global · 500), ingest.parser.max_concurrency (int · global · 8), ingest.dlq.replay_window_minutes (duration · global · 30), decisioner.timeout_ms (int · global · 500). Save affordance per row commits the change; sensitive values render as vault:// references rather than plaintext.
Banking Simulator
The simulator is the sandbox companion to the Databus. Operators rehearse onboarding flows, regression scenarios and chaos drills against synthetic data with no risk to production tenants.
Simulator runs
Databus administrators/admin/databus-simulator
Figure 9.10 — Simulator runs. Recent simulator runs with status and resulting fixtures.
CriticalThe simulator's safety middleware refuses to execute against a production environment. The page is hidden in production. Never disable the safety middleware to "just test once" — it has saved the platform from incident more than once.
Figure 9.13 — Simulator allowlist. Tenants explicitly cleared to receive simulator traffic in this environment.
Simulator services
SRE/admin/databus-simulator/system
Figure 9.14 — Simulator services. Per-service control panel for the simulator stack.
Platform
The multi-tenant administration console for platform operators.
Platform is the multi-tenant administration console where platform administrators manage the tenant organisations served by the deployment — creating, configuring and suspending tenant organisations and their domains. It is the operator's surface for tenancy itself, distinct from the per-tenant administration handled under Administration.
Tenant Management
Platform administrators/platform
Purpose
Create, configure and suspend tenant organisations and their domains from a single multi-tenant console.
Audience
Platform operators. The route requires platform:admin or system:admin.
When to use
Onboarding a new tenant organisation, adjusting an existing tenant's configuration or domains, or suspending a tenant.
Platform is a single-page module: selecting it in the left sidebar opens the Tenant Management console directly, with no module submenu. From here a platform administrator provisions a new tenant organisation, configures its domains and settings, and suspends or reactivates a tenant as required. Every action is permission-filtered and audited.
NoteScreenshots for this section are pending and will be added once captured against the live multi-tenant console.
Operations
Live health, services control, audit, batch and developer tools.
The Operations section is the SRE's home. It is where the platform itself is monitored, where services are started and stopped, where the audit and access logs are searched and where developer tools live for non-production environments.
System status
SRE, administrators/admin/system-status
Figure 10.1 — System status. Per-service health, version, build SHA and last-restart.
Services control
SRE (system:admin)/admin/servicesDev / staging only
Start, stop and restart any platform service. Wraps scripts/services.sh on the host. Refuses to run in production environments — production work goes through the institution's change-management process.
Figure 10.2 — Services control. Per-service status with start/stop/restart and a live console.
CriticalThe page is hidden when APP_ENV=production. Do not attempt to override the gate. Use your institution's change-management process to make changes in production.
Per-queue depth and ageing view. Used by team leads to balance load across shifts and by SREs to spot bottlenecks.
Figure 10.5 — Workflow queues. Open / in-review counts and SLA breaches by queue.
State machine
Everyone/workflow/state-machine
A visual diagram of the case state machine — useful for training and for explaining the workflow to auditors.
Figure 10.6 — State machine. Case lifecycle transitions and the actions that drive them.
Audit log
Compliance, administrators/admin/audit
Per-entity audit trail. Every change to every entity in the platform — by whom, when, from where, why — is written here append-only. The regulator-facing record.
Figure 10.7 — Audit log. Per-entity change log with actor, timestamp and full payload diff.
CriticalAudit log entries cannot be edited or deleted from the UI. Anyone who needs to redact a record must go through a documented, regulator-approved process — and that process itself is audited.
Seed or reset the demo personas defined in config/demo/personas/personas.yaml. Used to set up the platform for a sales demo, a customer training session or an integration rehearsal.
Figure 10.9 — Demo data console (admin view). Eyebrow SETTINGS → DEMO DATA; title Demo data console; subtitle "Populate every feature with realistic demo data, or reset the database back to the staging baseline. Disabled in production." Actions card with two destructive controls: blue Seed demo data (provisions the 10 personas defined in config/demo/personas/personas.yaml across customers, accounts, transactions, alerts, cases, blocks and SARs) and red Reset (wipes every demo_seed=true row, or every row in the reset-table list under the hard variant). Recent runs table shows the last three completed runs — seed · done · 100% · 10 personas (5/21 16:54), reset · done · 100% · 0 personas (5/21 16:14), seed · done · 100% · 10 personas (5/20 16:59) — with the created timestamp as a hyperlink to the individual job detail. The page is hidden when APP_ENV=production.
Notifications & Settings
Personal communication preferences and the per-user settings hub.
Notification centre
Everyone/notifications
Inbox of platform-issued notifications — assignments, mentions, SLA warnings, system advisories. Always reachable from the bell icon in the top bar.
Figure 11.1a — Notification centre (top). Most recent notifications across all categories.Figure 11.1b — Notification centre (middle). Category filters and bulk actions.Figure 11.1c — Notification centre (bottom). Older notifications and history.
The user's personal settings — name, language, timezone, default landing page, keyboard preferences, two-factor enrolment. Permission-gated tiles for administrative settings appear here only for administrators.
Permissions reference, glossary, and support escalation paths.
Permissions reference
A non-exhaustive listing of the most commonly assigned permissions and what they enable. The canonical source of truth is Role tiers, where the institution-specific bundles live.
Permission
Enables
Typical role
inbox:read
Open the unified Inbox.
Analyst, Team Lead, Compliance
alerts:read
See alerts and the alert queue.
Analyst
alerts:decide
Approve / decline alerts.
Analyst
cases:read / cases:create
Open cases and create new ones.
Analyst
customers:read / read_pii
Read customer records / unmask PII.
Analyst / Senior Analyst
transactions:read
Read transactions.
Analyst
blocks:request
Submit a block for approval.
Analyst
blocks:approve
Approve a block request.
Team Lead
blocks:lift / lift_regulatory
Lift a block (regulatory variant).
Team Lead / Compliance
sars:prepare / review / approve
Three-step SAR lifecycle.
Compliance Preparer / Reviewer / Approver
reports:read
Open the reports catalogue.
Compliance, Risk
screening:read
See screening surfaces.
Compliance, Senior Analyst
adverse_media:read
See adverse-media classifications and profiles.
Compliance
adverse_media:prompts_admin
Promote adverse-media prompt versions.
Compliance Admin
ml:read / ml:promote_production
Read ML registry / promote models to prod.
ML Engineer / ML Manager
workflow:read
See workflow queues and the state-machine view.
Team Lead, SRE
audit_log:read
Read the entity audit log.
Compliance, Admin
access_log:read
Read sign-in / lockout events.
Security, Admin
system:read
Read platform health.
SRE
system:admin
Full administration (short-circuit grant).
System Administrator
databus:read / databus:admin
Read databus state / configure it.
Databus Operator / Admin
access:grant / jit:approve
Approve JIT access requests.
Admin, Security
consortium:read
Read consortium intelligence.
Senior Analyst, Risk
branches:read / teams:read
Read the institution structure.
Admin
demo:admin
Reseed / reset demo data.
Demo Operator (non-prod)
NoteThe system:admin permission short-circuits every other gate. Grant sparingly and never to an integration or service account.
Glossary
Term
Definition
Alert
A single firing of a rule or model against a transaction. Triaged by an analyst.
Case
The durable investigation container. Holds alerts, transactions, evidence, decisions.
Scenario
A named fraud typology (e.g. FRD-001) — bundles rules and models.
Rule
Deterministic boolean expression evaluated over an incoming event.
Model
Statistical scorer producing a probability of fraud.
Block
Restrictive action on an account (PND, freeze) raised by maker-checker.